Understanding Inventory Turnover for Business Success
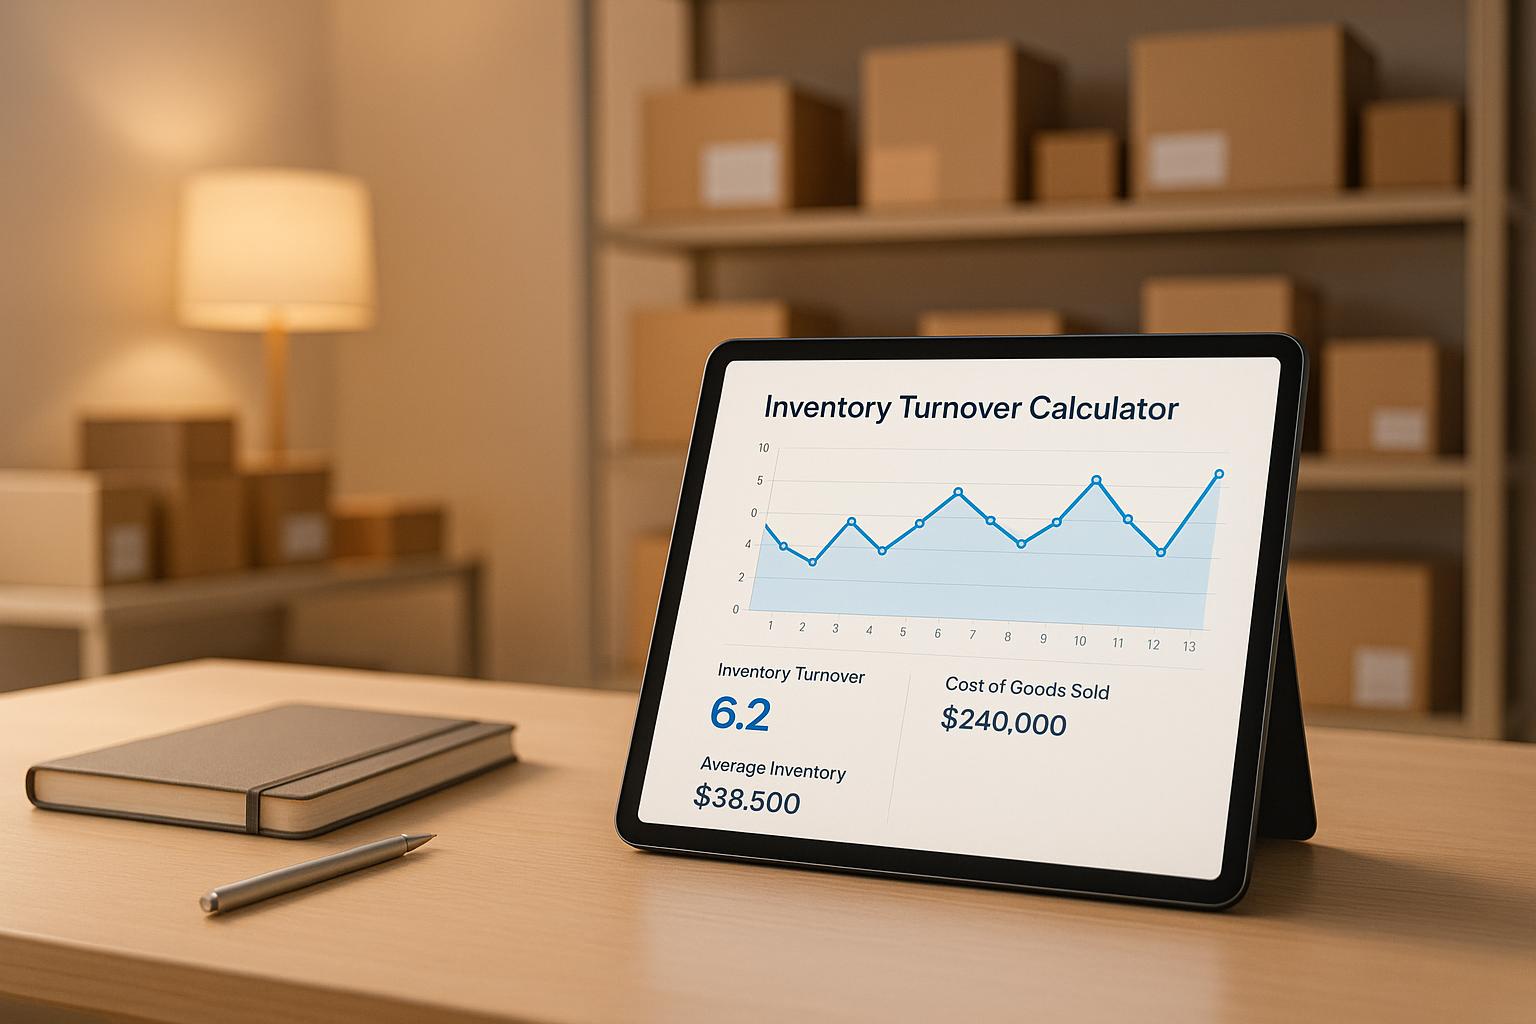
Running a business means keeping a close eye on how your products move. One key metric to track is how often your stock is sold and replenished, which can reveal a lot about your operational health. A handy tool like an inventory turnover calculator simplifies this process, letting you input basic figures to get instant insights without the math hassle.
Why Track Stock Movement?
When you know how frequently your inventory cycles, you can make better decisions about purchasing and pricing. If your stock sits too long, you’re tying up cash and risking obsolescence. On the flip side, a rapid cycle might mean you’re missing sales due to shortages. Getting this balance right can save money and improve customer satisfaction.
Beyond the Numbers
This isn’t just about crunching data—it’s about understanding your business rhythm. Are seasonal trends affecting your flow? Is a particular product lagging? Using a tool to monitor stock replacement rates helps you spot these patterns and act before small issues turn into costly problems. Whether you’re a small retailer or managing a larger operation, staying on top of these metrics is a game-changer for efficiency and growth.
FAQs
What exactly is inventory turnover, and why does it matter?
Inventory turnover measures how many times your stock is sold and replaced over a specific period. It’s a key indicator of how well you’re managing your inventory. A higher rate often means you’re selling efficiently, while a low rate might signal overstocking or slow-moving products. Knowing this helps you adjust purchasing, reduce holding costs, and keep cash flowing.
How do I find my Cost of Goods Sold (COGS) and Average Inventory Value?
COGS is the total cost of the goods you’ve sold during a period—check your income statement or accounting records for this figure. Average Inventory Value is trickier; add your starting and ending inventory values for the period, then divide by two. If you’ve got detailed records, you can average monthly values for more precision. Plug those numbers into our tool, and you’re set!
What’s a good inventory turnover rate for my business?
There’s no one-size-fits-all answer here—it depends on your industry. Retail businesses like grocery stores often have high turnover (think 10-20 times a year) because products move fast. Luxury goods or furniture stores might see lower rates, like 1-4 times, due to slower sales cycles. Compare your rate to industry benchmarks to see if you’re on track, and use it to spot trends in your own business over time.