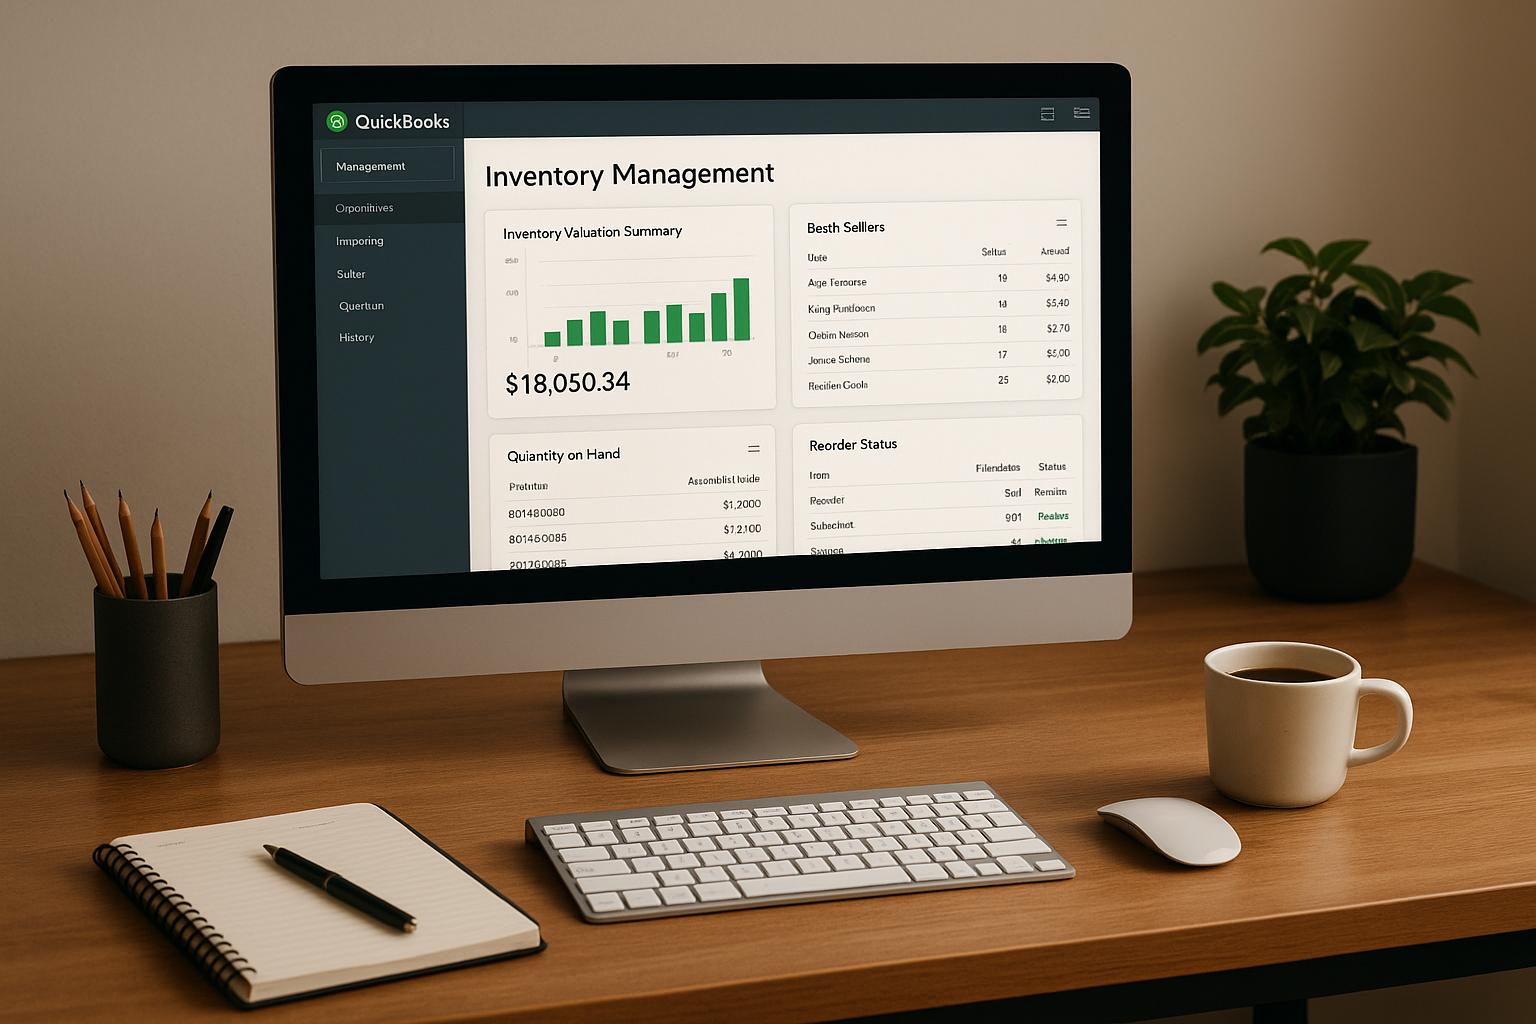
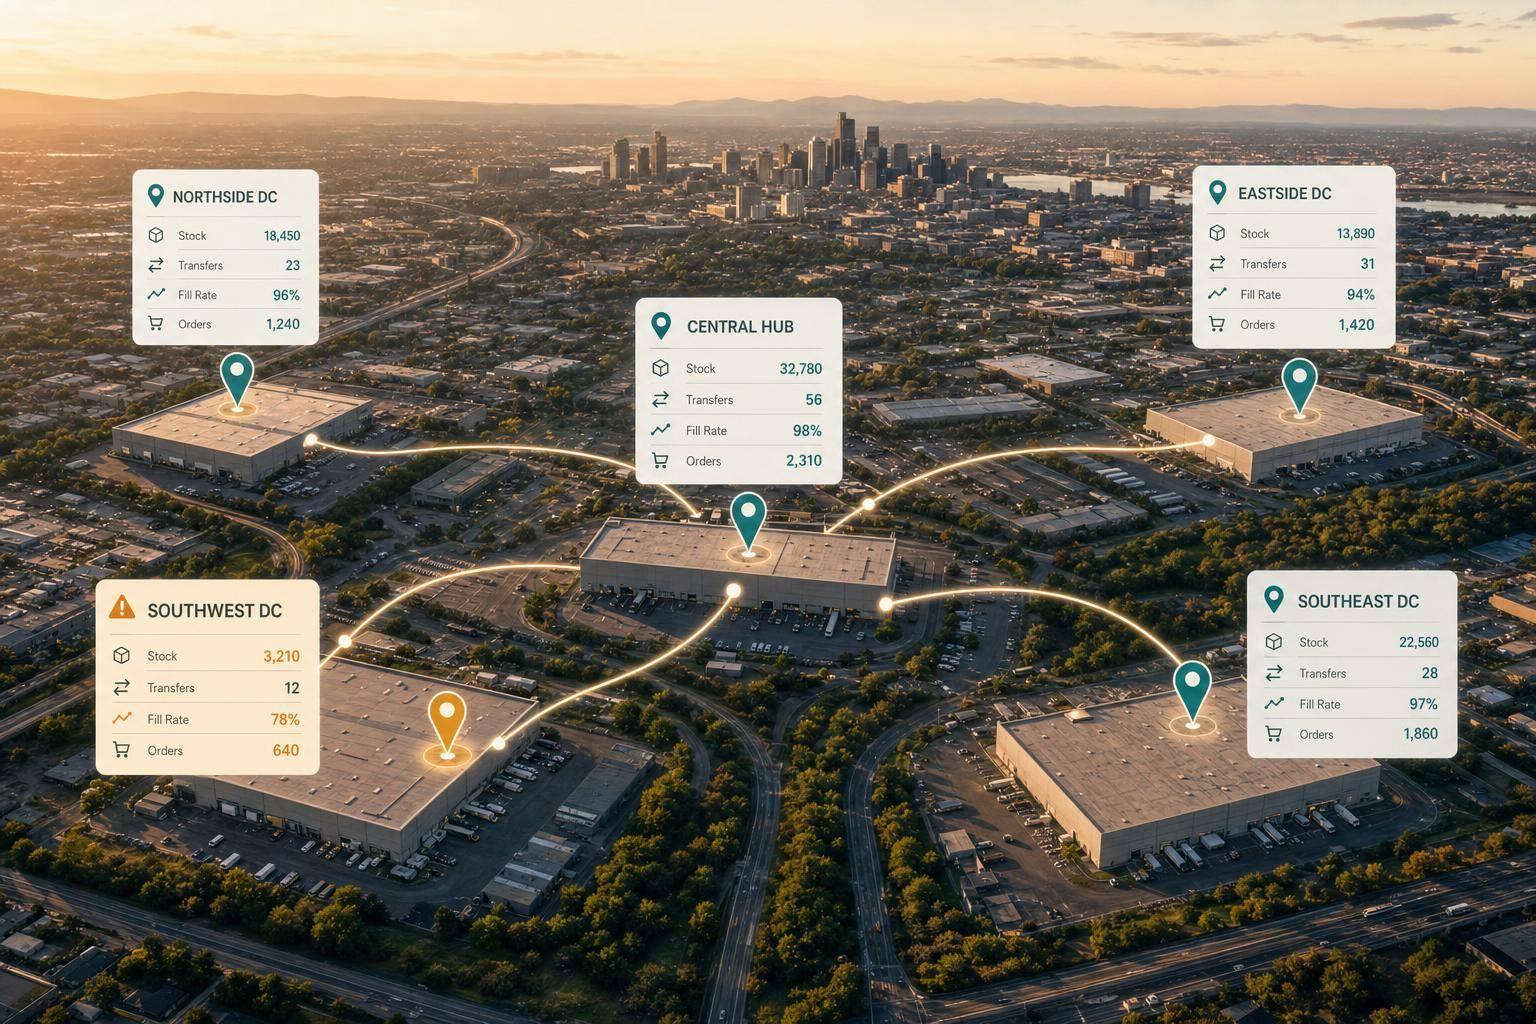
If you use QuickBooks Desktop across more than one warehouse, total inventory is not enough. What you need is a site-by-site view of stock, transfers, fill rate, and order status so you can see where orders may stall before customers feel it.
Here’s the short version:
- Single-site QuickBooks Desktop works well when all stock sits in one place.
- Multi-location reporting in QuickBooks Desktop requires Enterprise + Advanced Inventory + Multiple Inventory Sites.
- The main numbers to watch are:
- on hand by site
- committed and available by site
- stock in transit between sites
- fill rate by site, item, and date
- order status by location
- A common fill-rate target is 97%–98%.
- If your team needs live warehouse updates, mobile barcode use, and two-way sync, the inventory management software for QuickBooks Desktop starts at $90 per user per month or $900 per month for 10+ users.
What I take from this article is simple: a healthy company total can hide a warehouse problem. One site can be out of stock while another has extra units, and QuickBooks only shows that clearly when the multi-site setup is in place.
QuickBooks Demo 2025: Multi-Location Inventory | QuickBooks Enterprise Advanced Inventory | Platinum
sbb-itb-19ed50f
Quick Comparison
| Model | Best fit | What you can see | Main gap |
|---|---|---|---|
| Single-Site QuickBooks Desktop | One warehouse | On-hand, PO/SO quantities, reorder points, inventory value, order status | No location-level stock or transfer view |
| Multi-Location QuickBooks Desktop | More than one site | Stock by site, reorder status by site, transfer activity, site-based order review | More manual work and slower updates |
| Multi-Location + Rapid Inventory | Teams that need live warehouse data | Site-level stock plus live sync, barcode workflows, cycle counts, web access | Extra monthly cost |
Bottom line: if you ship from more than one location, your team should judge inventory by where the stock is, what is already spoken for, and whether transfers have actually been received. That is the core point of the article.
1. Single-Site QuickBooks Desktop Inventory Reporting
If your business runs from one location, QuickBooks Desktop - Pro, Premier, or Enterprise - handles the main inventory reports most teams need. Since all stock sits in one warehouse, you can track on-hand, committed, and incoming inventory without dealing with site-by-site reporting.
Stock Visibility
The starting point is the on-hand inventory report. It shows a real-time count of what’s physically in the warehouse.
Then you layer in two more numbers:
- Quantity on purchase orders for incoming stock
- Quantity on sales orders for stock already committed to customers
Put those together, and you get a much clearer view of what’s actually available to sell. Inventory value reports add the accounting side by showing what that stock is worth in dollar terms.
Fill Rate
For a single-site setup, fill rate comes down to the difference between what customers ordered and what you shipped. Backorder reports and partial shipment records make it easy to spot where inventory came up short.
Order Status
On the order side, teams usually lean on sales order status and purchase order status reports. These show where an order stands from open to shipped and help flag stalls, backorders, or partial fulfillment. Transfers and in-transit inventory aren’t part of the picture here.
These are the reports single-site teams use most.
| Report Type | What It Shows |
|---|---|
| On-Hand Inventory | Current physical stock count at the warehouse |
| Quantity on PO/SO | Incoming stock vs. committed customer orders |
| Reorder Report | Items falling below minimum stock thresholds |
| Inventory Value | Total dollar value of current stock |
| Sales Order Status | Order progress from picking to shipment |
| Purchase Order Status | Status of incoming vendor shipments |
That set works well when every unit is in one warehouse. Once inventory starts moving across multiple sites, those reports stop giving you the full picture.
2. Multi-Location QuickBooks Desktop Inventory Reporting
When inventory sits in more than one place, company-wide totals stop telling the whole story. You need to see what's in stock at each location, not just one rolled-up number.
That’s the main shift from single-site reporting to multi-location reporting. Instead of looking at inventory as one pool, you’re splitting it by site so each warehouse, store, staging area, truck, or storage point can be tracked on its own. In QuickBooks Desktop Enterprise, this works when Advanced Inventory is turned on and the Multiple Inventory Sites feature is enabled.
Stock Visibility by Warehouse
Managers don’t just need one inventory count. They need to compare stock across locations.
The Quantity on Hand by Site report shows how many units of each item are sitting at each warehouse. If you pair that with Inventory Valuation Summary by Site and Inventory Stock Status by Site, you can also check stock value and spot which site has dropped below its reorder point.
Use these reports to compare:
- on-hand quantity by warehouse
- inventory value by location
- reorder status for each site
Transfer Tracking and In-Transit Stock
As soon as stock starts moving between sites, transfers become part of the day-to-day inventory picture.
QuickBooks records these moves through the Transfer Inventory form. In that form, you enter the date, source site, destination site, items, and quantities. Those details help you match what was shipped with what was received.
QuickBooks also uses an In-Transit holding site for stock that has left one location but hasn’t been received at the next one yet. In plain English, the inventory moves from the source site to in-transit first, and then to the receiving site only after receipt is recorded.
Fill Rates by Site, Item, and Date Range
Fill rate shows how well each site is meeting demand. The formula is:
Fill Rate = (Units Shipped ÷ Total Units Requested) × 100
Looking at fill rate by site, item, and date range can show where service gaps are showing up. A common benchmark is 97%–98%, though targets should match your product mix and lead time.
Order Status by Site
When Multiple Inventory Sites is enabled, QuickBooks adds a Site column to sales orders, invoices, and sales receipts. That small change matters because it lets teams review order activity by location instead of lumping everything together.
From there, you can track order status by site and spot where delays are happening, including:
- open orders
- partial orders
- backordered orders
- shipped orders
- overdue orders
Stock, Transfers, Fill Rates, and Order Status by Site
These four reporting areas - stock, transfers, fill rates, and order status - answer four different day-to-day warehouse questions. The table below shows which report fits each question, who should own it, and how often the team should check it. The sections that follow explain how each report helps people make decisions at the warehouse level.
| Reporting Question | Recommended Report | Decision Owner | Review Frequency |
|---|---|---|---|
| What is on hand, committed, and available at each site? | Quantity on Hand by Site; Inventory Stock Status by Site | Warehouse manager | Daily; more often for high-volume items |
| Which transfers are pending, in transit, or overdue? | Transfer register with source, destination, reference number, ship date, receipt date, and status | Logistics coordinator | Daily |
| How much demand did each site fulfill on the first shipment? | Unit and line fill rate by site, SKU, and date range | Operations manager | Weekly; daily for high-volume sites |
| Which orders are open, partial, backordered, waiting on transfer, ready to ship, or completed? | Site-level order aging and fulfillment report | Order management or site supervisor | Daily |
Stock Visibility by Warehouse
A company-wide total can look fine while one warehouse is running short. That’s the trap.
Single-site totals only work when all inventory sits in one place. Once stock is split across warehouses, site-level ATP is what drives fulfillment decisions. Without it, teams can miss shortages at one site, overlook excess at another, and fail to catch negative ATP before orders start slipping.
Transfer Tracking and In-Transit Stock
Transfer reporting should track the transfer date, reference number, source site, destination site, quantity, ship date, expected receipt date, actual receipt date, and status.
This matters because transfers show why stock is moving between sites, not just where it happens to be sitting at the moment. That makes transfer reporting a core part of understanding current availability at each location.
Use an In-Transit site or similar status to keep the data clean. That way, the receiving site’s on-hand and ATP numbers don’t change until the receipt is recorded. It also stops the same units from showing up as available in both places at once.
Fill Rates by Site, Item, and Date Range
Fill rate means a lot more when you read it next to committed stock and transfer status. A warehouse can have on-hand stock and still post a poor fill rate.
Why does that happen? Usually, it comes down to one of a few issues:
- The stock is already committed to earlier orders
- A transfer has shipped but has not been received yet
- The inventory arrived after the customer’s required ship date
That’s the key point: on-hand quantity is not the same as usable quantity. So fill rate should be reviewed with committed quantity, ATP, and transfer status - not just the on-hand total.
Order Status by Site
Once stock and transfers are visible by site, order status makes it easier to see where fulfillment is breaking down.
Order status only becomes useful when it’s tied to a specific site. A cluster of "waiting on transfer" orders at one location points to a replenishment or transfer-planning issue. Too many "ready to ship" orders that aren’t moving usually signals a picking, packing, or carrier handoff problem. Partial shipments piling up at one site can point to fragmented stock or weak allocation rules.
Each sales order line should be tied to its fulfillment site - not just the customer’s billing or shipping address - so the team behind the delay is easy to identify. Site attribution puts the delay in plain view, and that’s how you tell whether stock and transfers are turning into actual fulfillment across all four core reporting questions.
Pros and Cons of Each Reporting Model
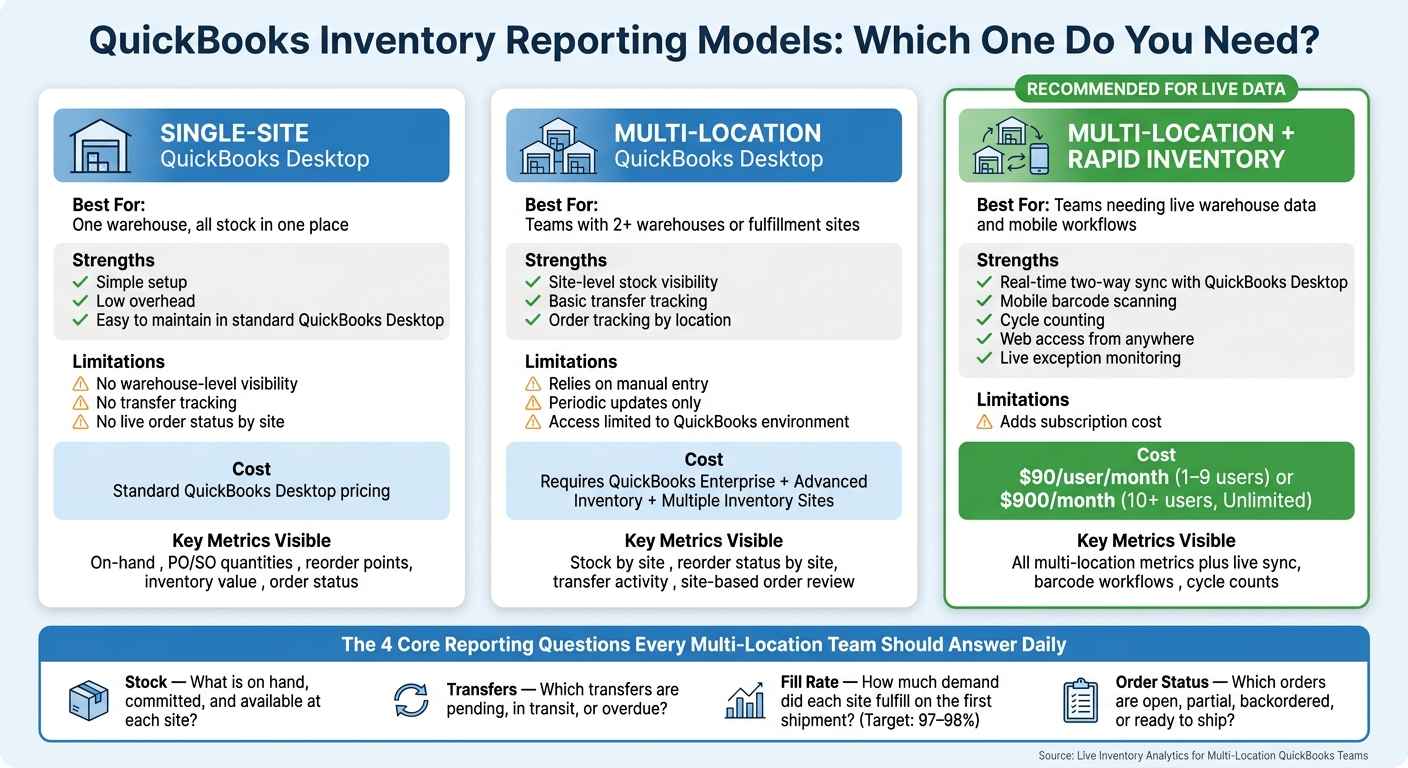
QuickBooks Multi-Location Inventory Reporting: Which Model Is Right for You?
No reporting model works for every team. But four metrics make the differences pretty clear: stock by warehouse, transfers, fill rates, and order status by site.
The table below shows the main tradeoff in each model. In plain English, you're usually trading off simplicity, visibility, or live updates.
| Reporting Model | Strengths | Limitations |
|---|---|---|
| Single-Site | Simple setup, low overhead, and easy to maintain in standard QuickBooks Desktop | Limited to one primary site, with no warehouse-level visibility, transfer tracking, or live order status by site |
| Multi-Location (Standard QuickBooks Desktop) | Better site-level stock visibility, with basic transfer and order tracking | Still depends on manual entry and periodic updates, with access limited to the QuickBooks environment |
| Multi-Location + Rapid Inventory | Real-time two-way sync with QuickBooks Desktop, mobile barcode scanning, cycle counting, web access from anywhere, and live exception monitoring | Adds subscription cost |
For teams that need current numbers by site, the big question is speed. How fast does warehouse activity show up in reports that people can actually use?
With standard QuickBooks reporting, that lag can become a problem. If updates come in late, site-level decisions get harder than they should be. Rapid Inventory is built to close that gap. It adds live sync and mobile capture, plus live exception monitoring, mobile barcode capture, and cycle counting. The two-way sync means receiving, transfer, and picking transactions flow back to QuickBooks Desktop automatically, which helps cut out spreadsheets and manual entry.
That extra speed comes with added cost. Rapid Inventory pricing is $90 per user per month for Pro with 1–9 users, or $900 per month for Unlimited with 10+ users.
Conclusion
The right reporting model comes down to one simple thing: where your inventory lives.
If inventory is received, stored, picked, and shipped from a single physical location, standard QuickBooks Desktop reporting usually covers what you need without extra moving parts. But when stock is spread across warehouses, branches, or fulfillment sites, one rolled-up total can blur the issues that need attention.
After you choose your model, run it with four reporting rhythms: live exceptions, daily site reviews, weekly fill-rate checks, and periodic reconciliation. Live exception monitoring helps you spot stockouts, negative balances, overdue transfers, backorders, and orders that may ship late. Use live alerts for stock and transfer issues, daily reviews for order status, weekly fill-rate checks, and periodic reconciliation for inventory value.
That rhythm matters because top-line totals can still miss what’s happening on the ground. A company-wide number may look fine while one warehouse is already out of stock. Site-level reporting is what surfaces that gap. Then you can act on it with a transfer, a routing change, or a purchase order.
If you want that visibility in one place, Rapid Inventory supports that workflow. For teams that need live warehouse visibility, barcode scanning, transfer tracking, and two-way QuickBooks sync, Rapid Inventory fills that gap.
FAQs
How do I know when I need multi-site inventory tracking?
You’ll likely need multi-site inventory tracking if you manage stock across more than one place, like warehouses, retail stores, delivery vehicles, or staging areas.
It becomes even more useful when inventory is still being tracked with manual data entry. That’s usually when things start to slip: stockouts hit one location, items are hard to find, and no one has a clear view of what’s on hand at each site.
Multi-site tracking helps you:
- see exactly where items are physically located
- set reorder points by location
- manage stock transfers between sites
- get accurate visibility into available quantities at each location
Put simply, if your inventory lives in more than one place, you need a system that shows what’s where without the guesswork.
What causes fill rate to drop at one warehouse?
A drop in fill rate at one warehouse usually comes down to inventory shortages. That often happens when local demand jumps, replenishment arrives late, or stock is spread unevenly across sites. In plain terms, one location runs short while another may be sitting on extra units. Theft, damaged goods, and poorly handled returns can also chip away at available inventory.
Another common issue is a mismatch between physical counts and system records. Manual entry mistakes, lag between systems, or other sync delays can throw off inventory accuracy. And when the numbers in the system don’t match what’s actually on the shelf, the result is pretty simple: missed sales, backorders, and a lower fill rate.
How should my team track inventory transfers in transit?
Use a dedicated, non-sellable in-transit location to track goods moving between warehouses. This lets you see stock that has left one site but hasn’t yet been received at the destination.
When you create the transfer in QuickBooks Desktop, add reference numbers and memos so the audit trail stays clear. Mobile barcode scanning can also help confirm the item, quantity, and transfer locations in real time.