Inventory forecasting helps businesses predict stock needs to meet future demand while managing costs. QuickBooks offers tools like real-time tracking, automated forecasting, and detailed reports to simplify this process. Using methods like moving averages, exponential smoothing, and expert insights, businesses can improve accuracy, avoid stockouts, and reduce excess inventory. Seasonal trends, multi-channel sales, and tools like Rapid Inventory further enhance forecasting precision. Here's how to optimize inventory management with QuickBooks:
- Key Forecasting Methods: Use data-driven techniques (e.g., moving averages, trend analysis) and expert insights for new products or market shifts.
- Seasonal Adjustments: Account for recurring patterns using tools like QuickBooks Online Advanced.
- Reorder Points: Calculate using daily usage, lead time, and safety stock.
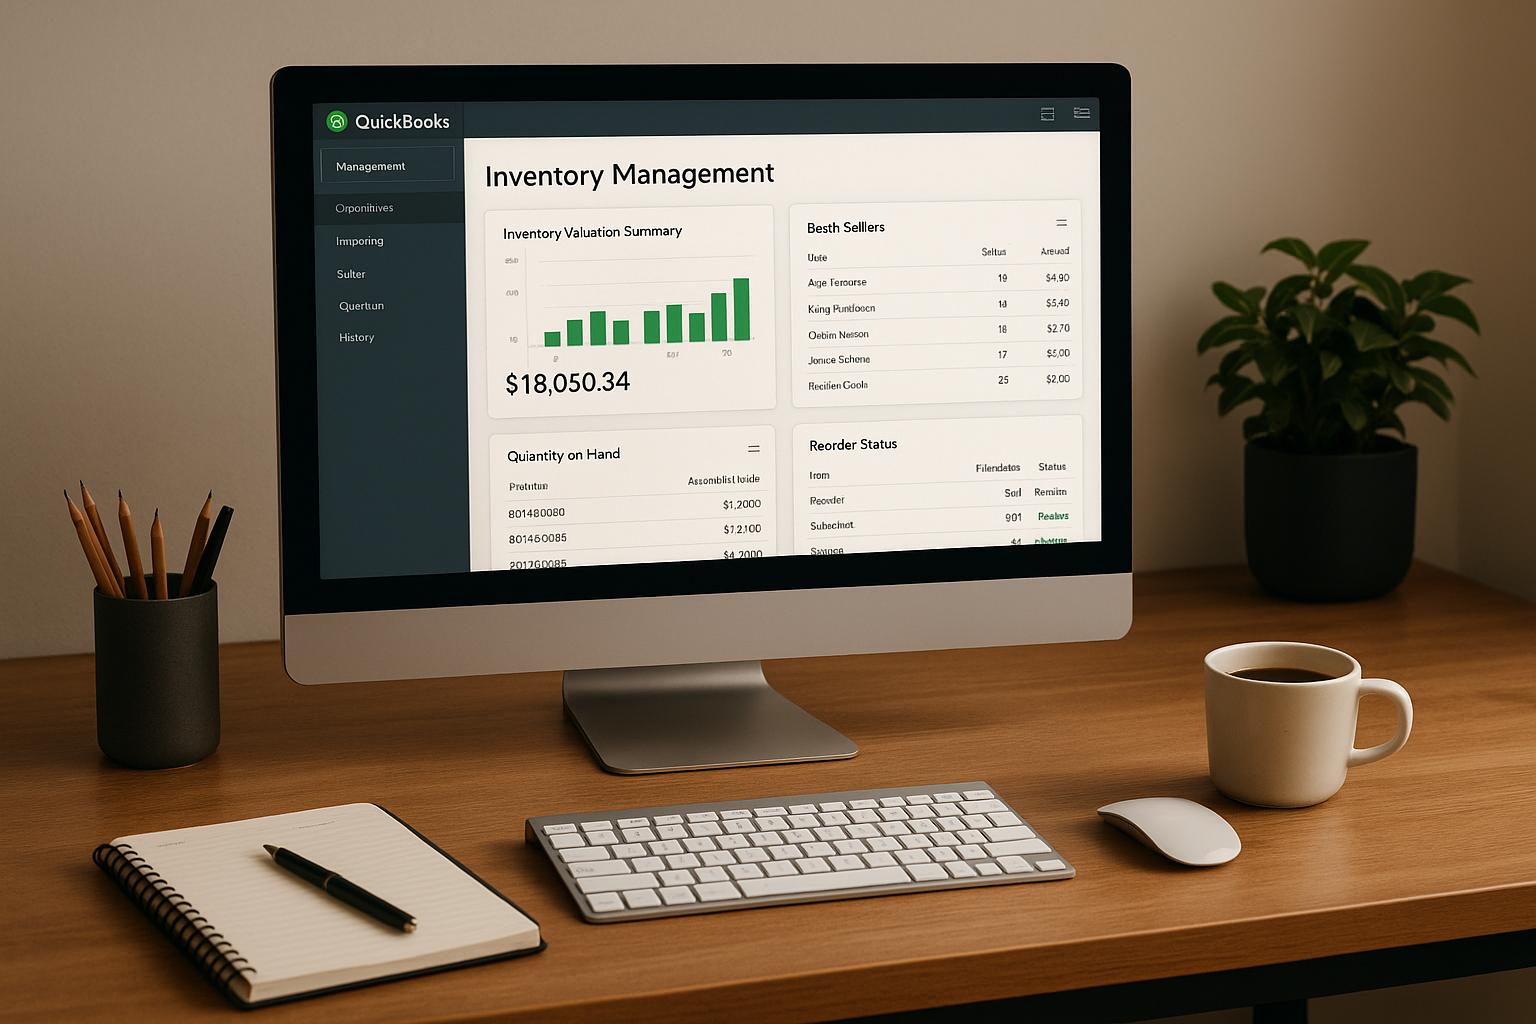
- Reports: Leverage QuickBooks' inventory reports (e.g., Inventory Valuation Summary) for actionable insights.
- Advanced Tools: Consider Rapid Inventory for features like barcode scanning, multi-location tracking, and automated reorder alerts.
QuickBooks simplifies inventory forecasting, making it easier to balance stock levels, improve cash flow, and meet customer expectations.
Inventory Forecasting Methods for QuickBooks

When it comes to forecasting inventory in QuickBooks, businesses typically rely on two main strategies: data-driven methods and expert-based approaches. The best results often come from blending these two. Data-driven techniques shine when historical sales data is steady, while expert judgment becomes indispensable for new product launches or sudden market changes. Let’s break down how these methods can fine-tune your forecasting.
Data-Driven Forecasting Techniques
Moving averages are one of the simplest ways to predict future demand. By averaging sales over a specific time period, this method works well for products with consistent demand and minimal seasonal fluctuations. For instance, if you sold 100, 120, and 110 units over three months, the forecast for the next month would be 110 units. Tools like Excel’s FORECAST and TREND functions can help small businesses apply this method effectively.
Exponential smoothing takes moving averages a step further by giving more weight to recent sales data. This allows businesses to respond faster to market changes, as recent trends carry more influence in the forecast than older data.
Trend projection identifies the overall direction of sales - whether they’re climbing or declining - and extends that pattern into the future. However, it’s important to exclude out-of-stock days from your data to avoid underestimating demand. Visualizing trends through graphs can also uncover patterns that may not be obvious in raw numbers.
For situations where historical data isn’t enough, expert insights can fill the gap.
Expert-Based Forecasting Methods
When launching a new product or facing unpredictable market shifts, expert-based forecasting becomes invaluable. This method draws on the knowledge of sales teams, managers, and industry experts. For example, the Delphi method uses a panel of experts who independently provide forecasts, refining their predictions through multiple rounds of feedback.
Sales teams can also contribute critical insights based on their direct interactions with customers and knowledge of upcoming promotions. QuickBooks supports this collaborative approach by allowing users to add qualitative notes alongside data. For instance, if a viral social media post temporarily spikes sales, you can flag it as an anomaly to avoid skewing future forecasts. By enabling input from marketing, finance, and operations teams, QuickBooks helps businesses create a more comprehensive forecast that accounts for real-world variables.
Seasonal Trends and Multi-Channel Sales in Forecasting
Seasonal trends require at least a year of data to identify recurring patterns like holiday shopping surges or weather-driven demand changes. QuickBooks Online Advanced simplifies this by offering tools to generate forecasts based on "Actuals from last fiscal year", ensuring seasonal variations are factored in. Relying only on recent months could result in forecasts that miss these cyclical spikes.
For businesses operating across multiple channels, QuickBooks’ forecasting tools let you break down data by "Class" or "Dimension", making it easy to track online sales separately from brick-and-mortar performance. Integrations with platforms like Shopify and WooCommerce further streamline this process by centralizing data from all sales channels into QuickBooks.
When dealing with seasonal items, it’s crucial to adjust for longer lead times during peak periods. For example, you can tweak the reorder point formula - (Average Daily Usage × Lead Time) + Safety Stock - to ensure you have enough stock arriving when demand is highest. For businesses needing more advanced tools, QuickBooks Enterprise offers over 200 built-in reports that can visualize seasonal demand fluctuations, helping you plan production and procurement with greater accuracy.
sbb-itb-19ed50f
Setting Up QuickBooks Desktop for Forecasting


How to Calculate Inventory Reorder Points and Safety Stock Formula
Getting QuickBooks Desktop set up correctly is the first step toward reliable forecasting. This involves enabling the right features, configuring inventory items, and ensuring your data is accurate and up to date.
Configuring Inventory Items and Reorder Points
To enable inventory tracking, head to Edit > Preferences > Items & Inventory, and check the box for Inventory and purchase orders are active.
If you operate multiple warehouses or store locations, activate Multiple Inventory Sites in the Advanced Inventory Settings. This feature lets you track stock levels at each location separately, which is crucial for avoiding stockouts in specific stores. Without it, you might see plenty of stock overall but still run into shortages at individual locations.
Next, set reorder points for each inventory item. Reorder points help you know when it’s time to replenish stock, preventing costly stockouts. Use this formula to calculate reorder points: (Average Daily Usage × Average Lead Time in Days) + Safety Stock. For instance, if you sell 10 units daily, your supplier takes 7 days to deliver, and you want a 20-unit buffer, your reorder point would be (10 × 7) + 20 = 90 units.
QuickBooks Desktop Enterprise allows you to set site-specific reorder points for individual locations. To do this, go to Lists, select Inventory Site List, and choose Set Reorder Points from the Activities dropdown. Keep in mind that site-specific reorder points don’t automatically roll up into a global reorder point. You’ll need to configure both separately. For example, while your total company stock may seem adequate, a high-traffic location could still run out unless its reorder point is set properly.
It’s also a good idea to review your average daily usage and lead times quarterly. This helps you account for seasonal changes or shifts in supplier performance. Since inventory carrying costs can represent 15% to 30% of total inventory expenses, setting reorder points too high can hurt your profit margins.
Once your inventory items and reorder points are in place, you can start generating reports to guide your forecasting.
Creating and Reading Inventory Reports
QuickBooks Desktop provides several inventory reports that are essential for forecasting. Access these by going to the Reports menu and selecting Inventory.
- The Inventory Valuation Summary calculates the total value of your stock by multiplying the average cost by the quantity on hand. This report is key for estimating future inventory investments.
- The Inventory Stock Status by Item report shows your current stock levels, quantities on sales orders, and quantities on purchase orders. Use this to identify items that have fallen below their reorder points and need immediate restocking. Be sure to account for lead times when interpreting this report to avoid delays.
- If you’re using QuickBooks Enterprise with lot tracking, the Inventory Stock Status by Lot Number report gives added detail by grouping quantities by lot numbers. This is especially useful for managing perishable goods or tracking expiration dates.
To keep your reports accurate, reconcile your physical inventory with QuickBooks data regularly. Use the Adjust Quantity/Value on Hand feature under Vendors > Inventory Activities to log discrepancies caused by breakage, spoilage, or counting errors. Set up a dedicated "Inventory Adjustments" account (Type: Cost of Goods Sold) in your Chart of Accounts to track these changes without skewing your sales data. After adjustments, run the Inventory Valuation Summary or Inventory Stock Status by Item reports to verify everything is correct before using the data for forecasting.
Inventory Forecasting Best Practices in QuickBooks
Once you've set up your inventory management software for QuickBooks Desktop, applying effective forecasting techniques can help improve accuracy and keep costs under control.
Using ABC Analysis for Inventory Prioritization
ABC analysis is a proven method to focus your attention on the inventory items that matter most. It’s based on the Pareto Principle, which suggests that around 80% of your revenue comes from just 20% of your inventory.
Here’s how it works:
- A items: These are your top-performing products that generate the majority of your revenue. They require precise forecasting and close monitoring to avoid running out of stock.
- B items: These are moderately valuable products that sell consistently but don’t dominate your revenue.
- C items: These are low-value items that make up most of your inventory but contribute the least to revenue.
"ABC analysis is an inventory management method that helps businesses group items into three categories based on value and impact on revenue."
- Marshall Hargrave, Financial Writer, QuickBooks
To apply this in QuickBooks Desktop, generate a Sales by Item Summary report to identify your top revenue drivers. For A items, set strict reorder points and conduct monthly counts. B items can be reviewed quarterly, while C items may only need a checkup twice a year.
It’s also a good idea to reclassify your inventory categories at least every quarter. This helps you adapt to seasonal trends or shifts in customer demand.
Managing Inventory Costs and Stock Levels
Once your inventory is prioritized, turn your attention to balancing costs and stock levels. Since inventory carrying costs can account for 15% to 30% of total expenses, overstocking can quickly eat into your profits.
To find the optimal order size, use the Economic Order Quantity (EOQ) formula. It helps minimize the combined costs of holding and ordering inventory:
EOQ = √((2 × Annual Usage × Order Cost) / Annual Carrying Cost per Unit).
For example, if you sell 1,200 units annually, your order cost is $50, and carrying cost per unit is $2, the EOQ would be roughly 245 units per order:
√((2 × 1,200 × 50) / 2) ≈ 245 units.
When it comes to safety stock, here’s a simple formula to calculate it:
Safety Stock = (Maximum Daily Usage × Maximum Lead Time) – (Average Daily Usage × Average Lead Time).
For instance, if your busiest day requires 15 units, your longest supplier lead time is 10 days, and your average is 10 units daily over 7 days, the safety stock would be:
(15 × 10) – (10 × 7) = 80 units.
Alternatively, you can estimate safety stock as 50% of your lead time demand for quicker calculations.
Make sure to review your reorder points and safety stock levels regularly - at least every quarter. Supplier reliability and customer demand can change, and outdated numbers might lead to either stock shortages or excess inventory. For A items, consider revisiting these metrics monthly during peak seasons. This is especially crucial since 67% of US consumers now expect delivery within two days or less.
Improving Forecasting with Rapid Inventory
For QuickBooks users looking to enhance their forecasting capabilities, Rapid Inventory provides tools that improve accuracy and streamline operations. While QuickBooks Desktop offers reliable inventory tracking, it falls short in advanced forecasting. Rapid Inventory bridges this gap with features like real-time visibility, automated reorder alerts, and multi-location tracking - all fully integrated with your existing QuickBooks setup.
The platform has earned a 5/5 rating from over 400 customers. Its standout feature is a two-way real-time sync with QuickBooks Desktop (Enterprise, Pro, and Premier), ensuring forecasts rely on live data from sales orders, purchase orders, and stock levels - not outdated information. Let’s dive into how its features refine inventory forecasting.
Forecasting Features in Rapid Inventory
Rapid Inventory boosts forecasting accuracy with mobile barcode scanning and cycle counting, achieving approximately 97% accuracy. It supports FIFO (First-In, First-Out) and FEFO (First-Expiration, First-Out) picking strategies, crucial for managing stock rotation and reducing waste - especially for perishable or time-sensitive goods. The inclusion of lot and serial number tracking with expiration dates ensures complete traceability, helping businesses decide when to move or discount products.
The platform’s real-time inventory reports go beyond showing stock on hand. They also account for quantities committed to sales orders and those arriving on purchase orders, reducing the risk of over-ordering. Additionally, built-in calculators for Safety Stock, EOQ (Economic Order Quantity), Inventory Turnover Ratio, and Days on Hand fine-tune forecasting parameters.
"Rapid Inventory helps us run our warehouse operations. Easy to use and reliable... we especially love the barcode scanning and mobile picking."
- Fernanda C, Director of Operations
These tools make it easier to manage inventory across multiple locations with precision.
Multi-Location Tracking and Inventory Workflows
For businesses managing multiple warehouses, retail outlets, or technician trucks, multi-location tracking is a game-changer. Rapid Inventory allows site-specific reorder alerts, tailored to regional demand fluctuations.
The cycle counting feature ensures continuous inventory accuracy, keeping forecasting reliable throughout the year. During cycle counts, transactions can be paused to address discrepancies without halting daily operations.
The Stock Replenishment Planner automates reorder reports, factoring in current lead times and demand trends. This feature simplifies decisions on when and how much to restock at each location.
"My team was up and running in a few days. Very straightforward and easy to use."
- Jacob, CEO
Rapid Inventory Pricing and Plan Features
Rapid Inventory offers straightforward pricing plans designed to complement QuickBooks and streamline forecasting workflows. With options for businesses of various sizes, the platform supports unlimited warehouses and locations.
| Plan | Monthly Cost | Best For | Key Forecasting Features | Support Level |
|---|---|---|---|---|
| Pro | $90 per user/month | 1–9 users | Lot/serial/expiration tracking, real-time reports, barcode scanning, reorder alerts, FIFO/FEFO picking | Email support, white-glove onboarding |
| Unlimited | $900 per month | 10+ users | All Pro features plus custom inventory reports and a dedicated account manager | Priority phone/email support, dedicated account manager |
Both plans include free training and onboarding, with most businesses going live within 6–7 days. The platform is web-based and works seamlessly with QuickBooks Desktop hosting solutions like Rightworks, Visory, and Swizznet.
"Simple and straightforward, very easy to learn and easy to work with. Onboarding was very smooth."
- Nicholas G, Owner
Conclusion
Inventory forecasting with QuickBooks doesn't have to be complicated. The secret lies in blending accurate historical data, dependable reorder points, and real-time visibility across your entire operation. While QuickBooks Desktop offers a solid base for tracking, businesses dealing with multiple locations or more complex inventory demands can improve both forecasting precision and efficiency by leveraging specialized tools.
Moving away from manual spreadsheets to automated two-way syncing eliminates double-entry errors and ensures forecasts are based on live data. Pairing this with regular cycle counting and mobile barcode scanning can elevate inventory accuracy to around 97%. When supply chains are unpredictable and demand fluctuates, strong, data-backed estimates are far more reliable than guesswork.
For QuickBooks users looking to take their forecasting to the next level, tools like Rapid Inventory provide a bridge between basic accounting software and advanced warehouse management. Features like FIFO/FEFO picking strategies and multi-location tracking empower businesses to forecast confidently across all sites. Pricing starts at $90 per user/month for the Pro plan, which includes free onboarding (a $600 value), and most companies are up and running in just 6–7 days.
Effective forecasting hinges on combining data-driven methods, team collaboration, and tools that integrate seamlessly with your systems. Whether you're aiming to avoid stockouts, manage seasonal demand, or optimize cash flow, the strategies outlined here can help you strike the right balance between maintaining sufficient inventory and avoiding excess capital tie-up.
FAQs
How do I know which forecasting method to use?
The best forecasting method for your business hinges on factors like your sales data, product seasonality, and market trends. If your product experiences seasonal fluctuations, a seasonal forecasting approach is the way to go. On the other hand, products with consistent, year-round demand may benefit from a simpler forecasting method. Take a close look at your sales history and demand patterns to determine whether a top-down, bottom-up, or alternative model suits your needs. This understanding is key to choosing the right method for effective inventory planning.
What data should I clean up before forecasting in QuickBooks?
Before diving into forecasting in QuickBooks, it's crucial to tidy up your inventory data to ensure accuracy. Start by addressing issues like duplicate items, quantity mismatches, negative inventory balances, and any missing or invalid item references. Take time to reconcile your physical inventory counts with your digital records, merge duplicate entries, and resolve any inventory sync errors. These steps lay the groundwork for accurate data, which is essential for creating forecasts you can trust.
When should I add Rapid Inventory to QuickBooks Desktop?
If you're looking for advanced inventory management tools beyond what QuickBooks Desktop offers, consider integrating Rapid Inventory. This solution provides features like multi-location tracking, barcode scanning, lot/serial number tracking, FIFO/FEFO picking, and real-time reporting to enhance your inventory operations.
For QuickBooks Desktop Enterprise users, you can take it a step further by enabling the Advanced Inventory feature. This unlocks additional options like FIFO costing and barcode scanning, making it easier to integrate Rapid Inventory and automate your workflows seamlessly.