Want to know if your inventory is helping or hurting your business? The inventory turnover ratio reveals how often your stock is sold and replaced over a specific period. Here's why it matters:
- High Turnover: Indicates strong sales and efficient inventory management but may risk stockouts.
- Low Turnover: Suggests overstocking, slow sales, or poor demand forecasting, leading to higher storage costs and outdated stock.
How to calculate it:
- Use the formula: COGS ÷ Average Inventory.
- Example: If your annual COGS is $500,000 and average inventory is $90,000, the ratio is 5.56, meaning stock turns over about 5.6 times a year.
Why it matters:
- A healthy ratio frees up cash for growth.
- Industry standards vary: Grocery stores aim for 10–15, while furniture retailers average 2–4.
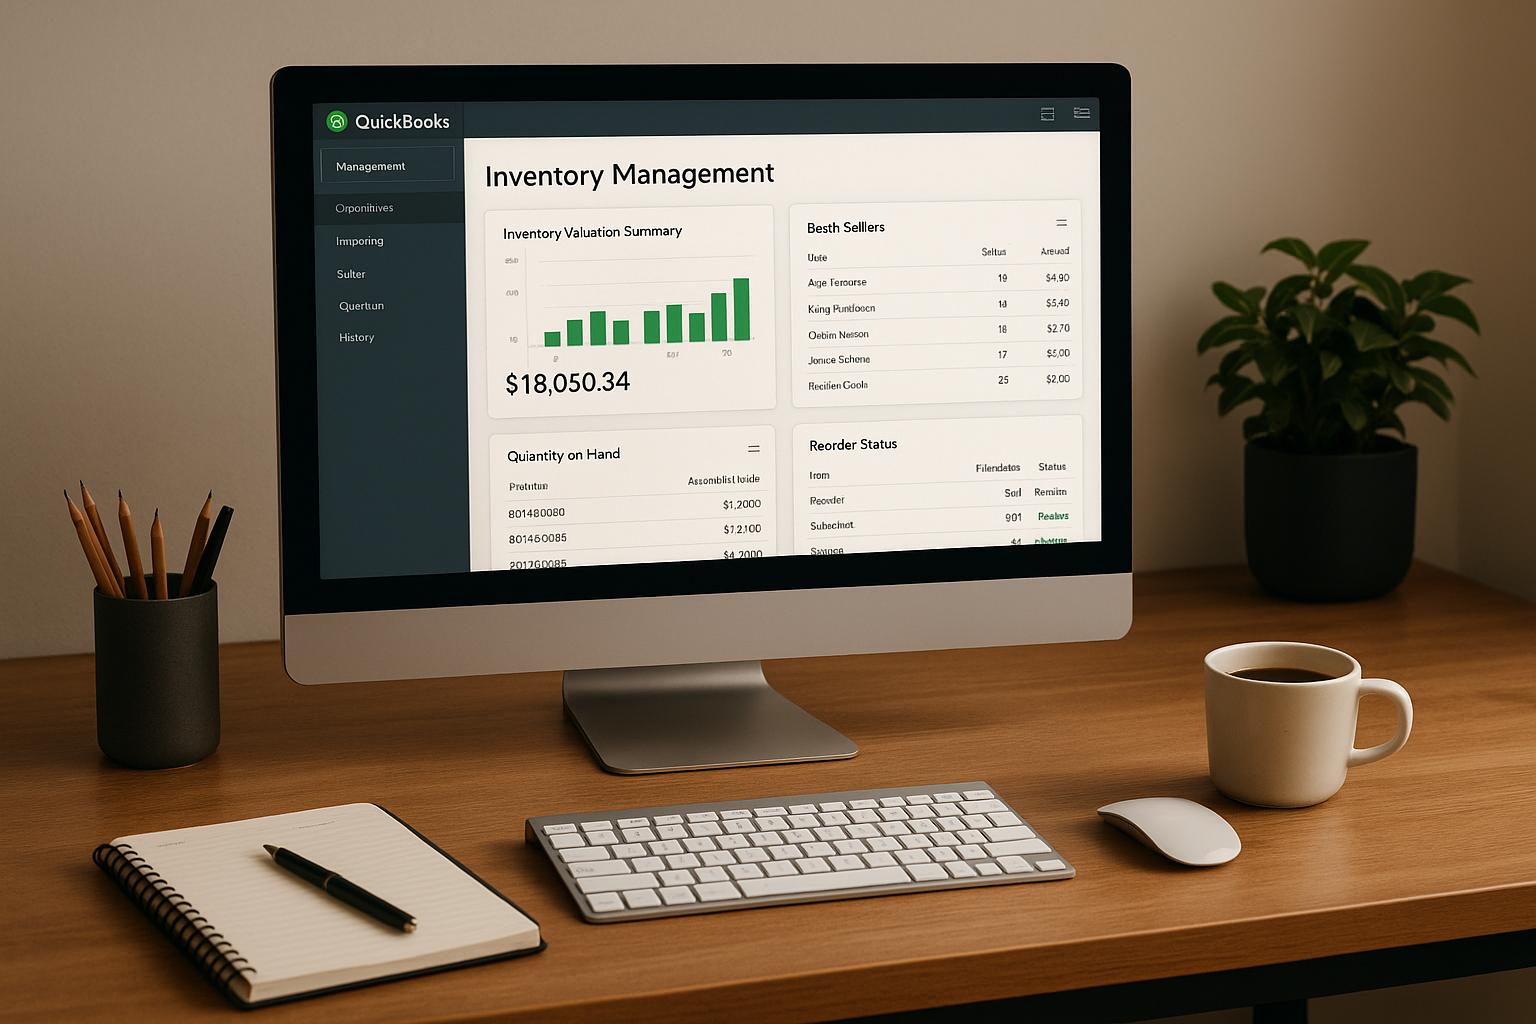
Tools like QuickBooks Desktop simplify tracking with real-time inventory reports. Balancing turnover reduces costs like storage, ordering, and stockouts, boosting profitability by up to 30%.
Keep reading to learn how to optimize your inventory turnover and cut costs effectively.
How to Calculate Inventory Turnover Ratio
Formula and Components
The inventory turnover ratio is calculated using this formula: COGS ÷ Average Inventory. Here, COGS (Cost of Goods Sold) includes the direct costs like materials and labor for producing goods sold, excluding indirect expenses. You can find this number on your income statement.
Average inventory is determined by the formula (Beginning Inventory + Ending Inventory) ÷ 2, which gives you the average stock level for the period being analyzed.
Sample Calculation
Let’s break it down with an example. Imagine a business in April 2025 with a COGS of $80,000. The beginning inventory for the month was $50,000, and the ending inventory was $45,000. To find the average inventory, calculate: ($50,000 + $45,000) ÷ 2 = $47,500. Next, divide the COGS by the average inventory: $80,000 ÷ $47,500, resulting in an inventory turnover ratio of 1.7 for the month.
For an annual calculation, consider a company with $500,000 in COGS and an average inventory of $90,000. Using the same formula: $500,000 ÷ $90,000 = 5.56. This means the company sold and restocked its inventory about 5.6 times over the year.
QuickBooks Desktop makes these calculations even easier.
Using QuickBooks Desktop

If you're using QuickBooks Desktop Enterprise (2024 R7+), you can enable the Inventory Turnover report by navigating to Edit > Preferences > Items & Inventory > Company Preferences, and selecting "Inventory and Purchase Orders are Active". Once activated, access the report through Reports > Inventory > Inventory Turnover Report.
"A higher turnover ratio or lower number of turnover days means your inventory is selling quickly, while the opposite means it takes longer to sell your inventory." - Intuit
This report provides both the turnover ratio and the Inventory Turnover Days (calculated as 365 ÷ Ratio), which shows how many days it takes to sell your inventory. You can also customize the report by adding or removing columns or applying filters to focus on specific product lines.
sbb-itb-19ed50f
What Your Inventory Turnover Ratio Means
High vs. Low Turnover
Once you’ve calculated your inventory turnover ratio, the number reveals a lot about how well you’re managing your stock. A high ratio suggests strong sales and efficient inventory management software practices. However, it can also signal potential risks like understocking or frequent stockouts, which could disrupt operations. On the plus side, a higher turnover reduces costs tied to holding inventory, such as warehousing fees, insurance, and the risk of items becoming outdated.
"A healthy inventory turnover ratio means you're converting stock into sales faster, which will free up cash for payroll, marketing, or other business expenses."
- Micah Hartmann, Content Marketer, inFlow Inventory
On the flip side, a low ratio often points to overstocking, sluggish sales, or poor demand forecasting. This can tie up your cash in unsold inventory and lead to higher carrying costs.
"A relatively low inventory turnover ratio may be a sign of weak sales or excess inventory, while a higher ratio signals strong sales but may also indicate inadequate inventory stocking."
- Kelly Squizzero, Acumatica
It’s important to compare your ratio against industry standards, as benchmarks vary widely. For example, grocery stores typically fall between 12 and 14, while furniture retailers average around 3 to 4. Manufacturing businesses often range from 4 to 7, and car dealerships usually see ratios of just 2 to 3. Always measure your performance against what’s typical for your specific sector.
Now, let’s look at how this efficiency translates into days using the Days Inventory Outstanding metric.
Days Inventory Outstanding (DIO)
DIO represents the average number of days your inventory stays unsold. You can calculate it using the formula: 365 ÷ Inventory Turnover Ratio. For instance, if your annual turnover ratio is 5.56, your DIO comes out to about 66 days.
"Inventory is money sitting on your shelves. If days inventory outstanding is high, that means more of your money is stuck on your shelf."
- Ana Cvetkovic, Shopify
A lower DIO indicates that inventory moves quickly, which supports better cash flow. On the other hand, a higher DIO means your stock is sitting for longer, tying up capital and increasing the risk of items becoming obsolete. For example, Walmart achieved a turnover ratio of 9.07 in fiscal year 2025, bringing its DIO down to roughly 40 days. This improvement highlighted faster sales and more efficient inventory management compared to the previous year.
Inventory Turnover Ratio - Meaning, Formula, Calculation & Interpretations
How Inventory Turnover Affects Costs

Inventory Turnover Cost Impact: Holding, Ordering, and Stockout Costs by Turnover Level
Your inventory turnover ratio has a direct impact on three major cost areas: holding costs, ordering costs, and stockout costs. Understanding these connections is crucial for maintaining the right stock levels without overstocking or running out of inventory.
Holding Costs
When inventory sits on shelves too long, holding costs add up quickly. These costs, which can account for 20–30% of inventory value annually, include warehouse rent, utilities, insurance, and more.
For example, a regional wholesale distributor found that 27% of its warehouse space was taken up by items that turned less than once a year. With a turnover ratio of just 3.2 - far below the industry average of 6.8 - they took action. By liquidating slow-moving items and setting specific goals for product categories, they raised their turnover to 7.4 in just nine months. This freed up $1.2 million in working capital and reduced warehouse space needs by 20%.
On top of storage costs, there’s the risk of "dead stock" - unsold inventory that becomes worthless due to expiration, damage, or shifts in market demand.
Ordering Costs
While low turnover drives up holding costs, high turnover brings its own set of challenges, especially with ordering expenses. Each new order comes with administrative tasks, transaction fees, and shipping costs.
For industries like grocery stores, where turnover ratios often range between 12 and 18, frequent ordering can quickly increase operational costs. Managing these expenses effectively is critical, especially in low-margin environments.
Stockout Costs
High turnover can also lead to stockouts, which hurt both sales and customer satisfaction.
Stockouts don’t just result in immediate lost revenue - they can cause long-term damage by driving customers to competitors and harming your reputation. Additionally, rush shipping fees for emergency reorders can pile up.
One precision equipment manufacturer tackled this problem by implementing tiered stocking policies based on how often items were used. This strategy boosted their turnover by 62% and cut stockout-related production delays by 74%.
Cost Comparison Table
Here’s a quick look at how turnover levels affect holding, ordering, and stockout costs:
| Turnover Level | Holding Costs | Ordering Costs | Stockout Risk | QuickBooks Tracking Tip |
|---|---|---|---|---|
| Low (<4) | High: Storage, insurance, and obsolescence risks can hit 20–30% of inventory value. | Low: Larger bulk orders reduce transaction fees. | Low: High safety stock prevents demand shortages. | Run "Inventory Aging" reports to identify slow-moving items for liquidation. |
| Medium (4–10) | Balanced: Makes better use of space and capital. | Moderate: Predictable ordering cycles. | Moderate: Requires precise demand forecasting. | Use ABC Codes to prioritize high-value items for frequent cycle counting. |
| High (>10) | Low: Less capital tied up; lower storage costs. | High: Frequent orders mean higher admin and shipping fees. | High: Risk of lost sales if supply chain delays occur. | Set automated "Reorder Points" and "Safety Stock" alerts to avoid gaps. |
Balancing these costs is critical for optimizing inventory turnover. Businesses that find the right turnover balance typically see profitability improve by 20–30% compared to their competitors. The key isn’t about maximizing or minimizing turnover - it’s about finding that sweet spot where costs are controlled, and products are always available when needed.
How to Improve Inventory Turnover
Methods for Better Turnover
Improving inventory turnover starts with aligning purchases to match historical sales trends and using tools like ABC Analysis to prioritize high-revenue items while identifying slower-moving stock. This helps reduce excess inventory and the costs of holding it.
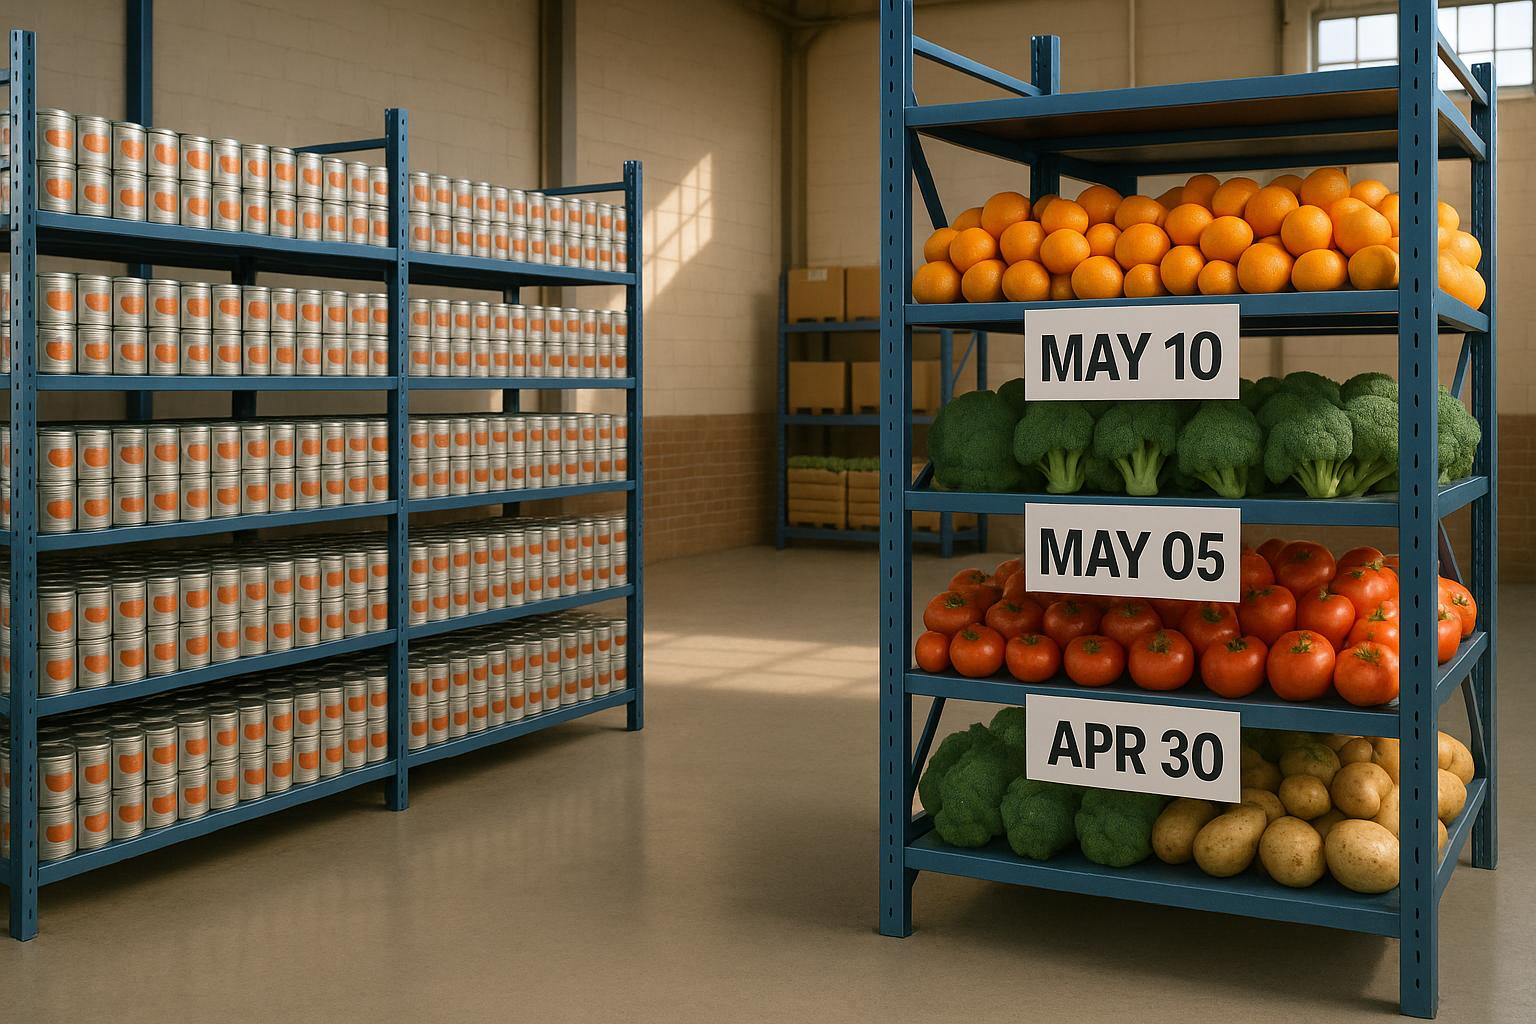
One effective method is setting automated reorder points, which trigger alerts when stock reaches a predefined minimum level. This ensures timely replenishment and prevents stockouts. Additionally, using proven techniques like FIFO (First In, First Out) or FEFO (First Expired, First Out) can help move inventory systematically and reduce waste.
Another key strategy is cycle counting, which replaces the disruptive annual physical inventory check with frequent, smaller audits. When paired with tools like mobile scanners and real-time syncing, this method can improve inventory accuracy to around 97%.
"Barcoding is one of the best features... It has simplified the work." - Travis Pollock, Project Manager
For slow-moving items, strategic pricing methods such as bundling, bulk discounts, or seasonal markdowns can help clear out inventory, freeing up valuable warehouse space.
These foundational strategies pave the way for leveraging technology to make inventory management more efficient.
Using Rapid Inventory
Technology is a game-changer for inventory turnover, and Rapid Inventory offers solutions that integrate seamlessly with existing systems. Its two-way QuickBooks sync ensures instant updates across all sales channels and locations, helping to avoid overselling or stockouts. Additionally, mobile barcode scanning speeds up processes like receiving, picking, and cycle counting while reducing errors caused by manual data entry.
The platform's multi-location tracking centralizes stock information, making it easy to transfer inventory between locations based on demand. With real-time reporting, you can quickly identify slow-moving items and take action before they turn into dead stock.
"Having that stock control is incredible... Whatever information we want, we can have it at the click of a button, and that's the key to our success." - Colin Gilhespy, Co-Owner and Managing Director at Cave Direct
Rapid Inventory also supports FIFO/FEFO picking strategies, complete with lot and serial number tracking, ensuring accurate Cost of Goods Sold (COGS) reporting and minimizing spoilage. The system can even automate reorder points and generate purchase orders, ensuring inventory is replenished only when necessary, which helps optimize cash flow.
Pricing for Growing Businesses
Rapid Inventory offers flexible pricing plans designed to grow with your business. The Pro Plan, priced at $90 per user per month, includes features like unlimited warehouses and locations, lot and serial number tracking, barcode scanning, real-time reporting, and free training and onboarding. For larger teams, the Unlimited Plan is available at $900 per month, covering unlimited users, custom inventory reports, a dedicated account manager, and priority support.
Both plans include comprehensive training and ongoing support to ensure a smooth implementation. With over 800 million small businesses and self-employed individuals using QuickBooks, Rapid Inventory provides an efficient way to enhance inventory management without the need to switch accounting systems.
Key Takeaways
Keeping a close eye on inventory turnover is essential for managing costs and ensuring efficient inventory control. The inventory turnover ratio shows how often your stock is sold and replaced, offering insights into both efficiency and cash flow. For most general retailers, a ratio between 4 and 6 is considered healthy, while top eCommerce businesses often aim for 8 or higher. Using COGS (Cost of Goods Sold) instead of sales figures ensures more precise calculations by excluding retail markups.
This ratio directly affects three major cost areas:
- Holding costs: Expenses like warehousing, insurance, and the risk of inventory becoming obsolete.
- Ordering costs: Fees related to shipping and placing frequent orders.
- Stockout costs: The impact of lost sales and unhappy customers when items are out of stock.
A low turnover ratio ties up cash in unsold inventory, which might need heavy discounting to clear. On the flip side, a very high ratio could drive up ordering costs due to frequent restocking and increase the risk of running out of stock.
To tackle these challenges, businesses can use strategies like ABC Analysis, setting automated reorder points, and applying FIFO (First In, First Out) or FEFO (First Expired, First Out) methods. Cycle counting, combined with mobile barcode scanning, also helps maintain inventory accuracy by replacing disruptive annual counts with smaller, more frequent checks.
For QuickBooks Desktop users, Rapid Inventory offers tools to streamline inventory turnover without needing to switch accounting systems. Features like two-way QuickBooks sync, multi-location tracking, and automated reorder points give U.S.-based businesses the ability to reduce manual errors and make smarter decisions about pricing and purchasing.
Ultimately, effective inventory management is a key driver of profitability. Optimizing inventory turnover can lead to a 20–30% increase in profitability.
FAQs
What’s a good inventory turnover ratio for my industry?
A good inventory turnover ratio usually falls between 5 and 10, though this can differ depending on your specific industry and business model. To figure out the right range for your business, take into account things like the type of products you sell, current market demand, and how your operations are structured.
How can I raise turnover without increasing stockouts?
To boost inventory turnover without risking stockouts, it's all about syncing your stock levels with demand and simplifying your sales processes. Start by cutting down on excess inventory and overstocking - this not only frees up cash but also slashes storage expenses. Take a close look at your sales data and demand trends regularly. By doing so, you can tweak your purchasing and sales strategies, keeping products moving quickly while still having enough stock on hand to meet customer expectations.
Should I calculate turnover monthly or annually?
The choice ultimately hinges on what your business needs. Annual calculations give you a high-level perspective, perfect for strategic planning and evaluating overall performance. On the other hand, monthly calculations dive into the details, making it easier to identify seasonal patterns, respond swiftly to shifts in demand, and fine-tune your strategies. Many businesses find value in combining the two - using monthly data for day-to-day decisions and annual data for long-term planning and benchmarking.