Real-time inventory reporting helps businesses avoid stockouts, reduce excess inventory, and streamline operations. By integrating tools like QuickBooks Desktop and Rapid Inventory, you can track inventory across multiple locations, automate updates, and make data-driven decisions. Below are the 10 critical metrics every business should monitor to improve inventory management:
- Stock Turnover Ratio: Measures how often inventory is sold and replaced. A higher ratio indicates efficient stock usage.
- Stock Turnover Days: Tracks the average number of days inventory is held before being sold.
- Stockout Rate: Shows how often items run out of stock, impacting sales and customer satisfaction.
- Reorder Point: Determines the minimum stock level to trigger reorders, factoring in lead times and demand.
- Inventory Turnover: Evaluates how well inventory translates into revenue, balancing between overstock and stockouts.
- Cost of Goods Sold (COGS): Tracks direct costs of inventory to assess profitability.
- Gross Profit Margin: Measures revenue after covering inventory costs, helping refine pricing strategies.
- On-Hand Inventory Levels: Provides real-time visibility into stock availability for better order fulfillment.
- Backorder Rate: Reflects the percentage of delayed orders due to insufficient stock.
- Cycle Count Accuracy: Ensures physical inventory matches system records, reducing errors and inefficiencies.

10 Key Metrics for Real-Time Inventory Reporting
How to use inventory reports in QuickBooks Enterprise

1. Stock Turnover Ratio
The stock turnover ratio measures how often inventory is sold and replaced over a specific period. To calculate it, divide your Cost of Goods Sold (COGS) by your Average Inventory during that time. For instance, if your COGS is $500,000 and your average inventory is $100,000, your turnover ratio is 5. This means your inventory cycles through completely five times in that period.
Real-Time Tracking Capability
QuickBooks Enterprise 2024 simplifies this process with its "Inventory Turnover by Item" report. This tool automatically pulls COGS data and calculates average inventory using the standard formula. You can filter out zero-quantity items to focus only on active stock and set custom date ranges to analyze seasonal trends. This automation provides instant insights to guide inventory decisions.
Impact on Inventory Management
Knowing your turnover ratio helps you align inventory levels with actual demand. A high ratio often reflects strong sales and efficient use of storage space, while a low ratio may indicate overstocking or weak demand. For example, in the bar and restaurant industry, an ideal ratio typically falls between 4 and 8. However, extremes in either direction can signal issues - too high might mean stock shortages, while too low suggests excess inventory tying up cash.
Integration with QuickBooks Desktop

QuickBooks Enterprise's turnover report offers real-time metrics to aid in precise inventory planning. For example, a turnover ratio of 2.5 means your inventory gets replenished roughly every 146 days. These insights help fine-tune reorder points based on actual performance rather than relying on rough estimates.
Preventing Stockouts and Boosting Efficiency
By leveraging real-time tracking and QuickBooks integration, you can monitor turnover trends and make proactive adjustments. A very high turnover ratio might warn of insufficient stock to meet demand. On the other hand, persistently low turnover for certain items could signal the need to discount or liquidate excess inventory, freeing up cash and storage space. By reviewing turnover trends weekly, you can quickly identify supply chain disruptions or shifts in customer preferences and adjust your inventory strategy accordingly.
2. Stock Turnover Days
Digging deeper into your stock turnover ratio, stock turnover days offer a more detailed view of your inventory management. Also known as Days Sales of Inventory (DSI) or Days on Hand (DOH), this metric reveals how many days, on average, it takes to sell your inventory. To calculate it, divide 365 by your inventory turnover ratio. For instance, with a COGS of $10,000 and an average inventory value of $4,000, your turnover ratio is 2.5. This results in 146 turnover days (365 ÷ 2.5).
Real-Time Tracking Capability
QuickBooks Enterprise 2024 simplifies this process with its Inventory Turnover report. This tool automatically calculates turnover days for each item in your system. It also provides a comprehensive view that includes the last sell date, cost per unit, sales price, quantity on hand, and reorder points. By sorting items by "Turnover Days", you can quickly identify which products are moving and which are stuck on the shelves.
As William "Bill" Murphy from Insightful Accountant puts it:
"This is one of the most valuable inventory reports we've ever had made available to us... if you have an inventory-centric business, this is the kind of report you've been needing".
This report integrates seamlessly with QuickBooks Desktop, giving you live, unified insights into your inventory.
Impact on Inventory Optimization
A lower turnover day count indicates faster inventory movement, which boosts cash flow and lowers storage costs. On the flip side, higher turnover days suggest inventory is sitting too long, tying up funds and increasing the risk of obsolescence. However, if turnover days drop too low, you might face stockouts. As Vera Lim from QuickBooks explains:
"If your average days needed to sell inventory is too low, you have the risk of running out of stock".
Since carrying costs often represent about 25% of total inventory value, maintaining the right balance is key.
Integration with QuickBooks Desktop
To access these insights, enable inventory tracking by navigating to Edit > Preferences > Items & Inventory > Company Preferences and selecting Inventory and Purchase Orders are Active. The report automatically pulls COGS and calculates average inventory. You can compare current inventory data with past periods to identify trends or use seasonal date ranges to evaluate performance during peak times. This data-driven approach eliminates guesswork, helping you make informed reorder decisions.
Relevance to Preventing Stockouts and Improving Efficiency
Tracking turnover days allows you to adjust pricing and reorder points proactively. If turnover days increase, consider discounting slow-moving items or ramping up marketing. If they drop too low, you may need to raise prices or increase buffer stock. Features like "Hide Zero Quantity-on-hand Items" help you focus on active inventory, enabling quicker decisions. By monitoring this metric weekly, you can detect demand shifts early and refine your inventory strategy to maintain optimal stock levels. Pairing these insights with QuickBooks Desktop reports ensures you stay ahead of inventory challenges.
3. Stockout Rate
The stockout rate reflects how often your inventory runs out of a specific item. It’s calculated by dividing the number of stockouts by the total orders, then multiplying by 100 . This metric is a clear indicator of how effectively your supply chain keeps up with demand. For retailers and e-commerce businesses, a stockout rate exceeding 3% can be a red flag, often leading to frustrated customers and lost sales. Globally, inventory issues like stockouts and overstocking cost retailers an estimated $1.8 trillion USD in 2023.
Real-Time Tracking Capability
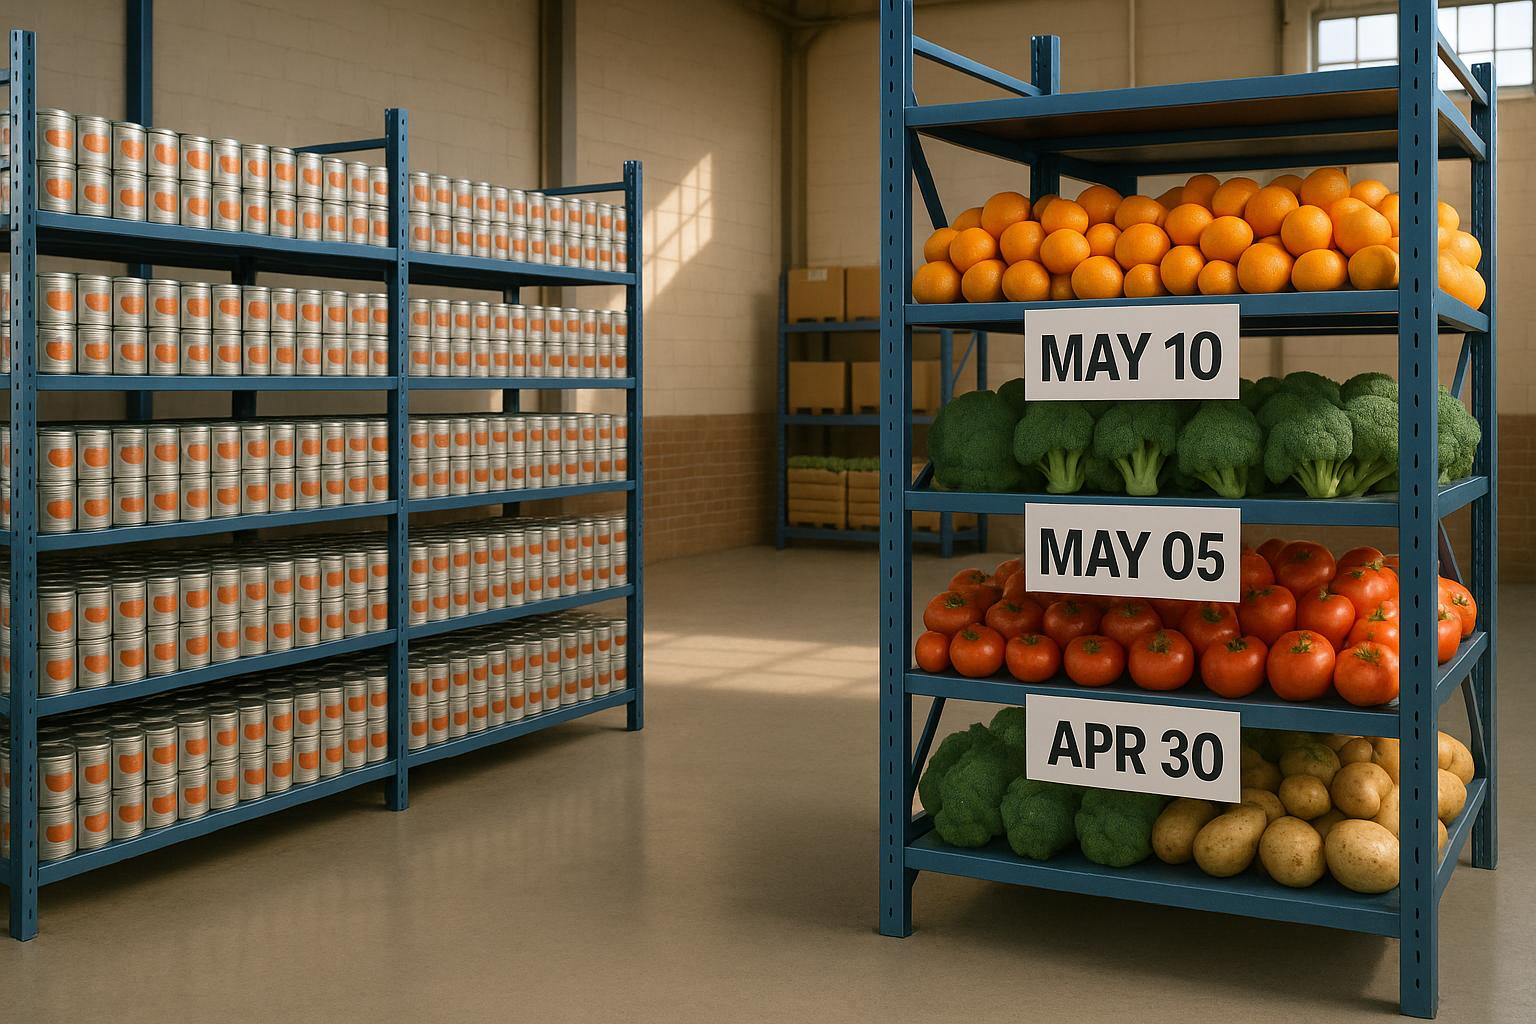
Real-time tracking shifts stockout management from a reactive scramble to a proactive strategy. Take, for instance, a grocery chain that, in 2025, adopted an RFID-based inventory system to combat frequent stockouts in fresh products. Within just a few months, they cut stockouts for perishables by 30%. Similarly, a global e-commerce leader paired real-time tracking with predictive analytics to handle sudden demand surges, slashing stockout incidents by 40%.
As Amarnath Immadisetty, Senior Manager of Software Engineering at Lowe's, puts it:
"Real-time inventory management systems solve much of the pain that characterizes general business in the retail industry... occasioned by stockouts and overstocks".
These systems also provide automated alerts when stock levels dip too low. Beyond improving inventory visibility, they help control costs by ensuring timely replenishments.
Impact on Inventory Optimization
When stockouts occur, businesses often resort to emergency purchases, which can cost 15-25% more than routine procurement. Real-time inventory systems reduce these inefficiencies by cutting manual stock checks by 35% and minimizing shipping errors by 78%. For example, a mid-sized electronics retailer introduced real-time tracking and, within six months (by July 2025), lowered inventory carrying costs by 25% - unlocking $150,000 in working capital.
Integration with QuickBooks Desktop
QuickBooks Desktop offers real-time stock tracking and automated alerts when inventory reaches reorder thresholds. It also analyzes buying and selling trends, enabling businesses to adjust reorder points before shortages occur. For advanced needs like multi-location tracking or FIFO inventory strategies, Rapid Inventory integrates seamlessly with QuickBooks Desktop. It adds features like mobile barcode scanning, two-way syncing, and web-accessible inventory reports. Together, these tools ensure accurate inventory data, which is critical for keeping stockouts under control .
Relevance to Preventing Stockouts and Improving Efficiency
Short-term data is key for accurate forecasting - three-month demand projections are more effective for avoiding stockouts than long-term estimates. If your stockout rate rises, adjust reorder points by factoring in sales velocity and supplier lead times . Monitoring supplier performance is equally important; high variability in lead times often requires higher safety stock levels . Finally, calculate the financial impact of stockouts using this formula: (Lost Sales per Unit × Margin per Unit) + (Cost of Expediting Orders). This approach helps balance the 20-30% carrying costs of excess inventory against the potential revenue loss from understocking.
4. Reorder Point
The reorder point (ROP) represents the minimum inventory level needed to meet customer demand. When stock falls below this threshold, it signals the need to place a new order. The formula to calculate ROP is simple: (Average Daily Usage × Average Lead Time in Days) + Safety Stock.
Real-Time Tracking Capability
With real-time tracking, you can ditch manual spreadsheets and gain instant visibility into your inventory. This includes stock levels, on-order items, and their locations. Automated alerts specific to each site notify you when it's time to reorder. These systems also sync data across multiple locations, ensuring orders are placed precisely when needed. As Ben Oliveri from QuickBooks explains:
"Reorder point (ROP) is a supply chain management technique that businesses can use to guide this delicate balancing act to improve inventory operations, avoid stockouts, and maintain ideal inventory levels."
This real-time insight not only keeps your inventory in check but also plays a key role in managing costs and evaluating supplier performance.
Impact on Inventory Optimization
Nailing your reorder point is essential for controlling costs. Inventory carrying costs can make up 15% to 30% of total inventory expenses. By accurately calculating safety stock - essentially the buffer between maximum and average lead time demand - you can guard against delays. Monitoring supplier performance is equally important. Real-time reporting lets you track actual delivery times versus expectations, helping you identify your most reliable suppliers.
Integration with QuickBooks Desktop
For QuickBooks Desktop users, the "Advanced Inventory" feature in Enterprise editions offers inventory tracking and reorder point settings. Tools like Rapid Inventory integrate seamlessly with QuickBooks via the QuickBooks Web Connector, enabling real-time updates and automated alerts across all locations. Pairing these features with regular cycle counts can improve inventory accuracy to around 97%. This streamlined process supports better inventory decisions without added complexity.
Relevance to Preventing Stockouts and Improving Efficiency
Reorder points aren't a "set it and forget it" strategy. It's important to review key metrics like average daily sales and supplier lead times at least quarterly to account for seasonal changes. Businesses with seasonal demand should adjust lead time and usage calculations accordingly. Additionally, standardizing SKUs and properly mapping fields before syncing QuickBooks with external warehouse systems can prevent errors and mismatches. By doing this, you can avoid both overstocking and understocking, cutting carrying costs and minimizing lost sales opportunities.
5. Inventory Turnover
Inventory Turnover is a key metric for evaluating how efficiently your business manages stock. It measures how often your inventory is sold and replaced within a specific time frame. The formula is straightforward: divide your Cost of Goods Sold (COGS) by your average inventory value. This gives you a clear picture of how well your inventory translates into revenue.
Real-Time Tracking Capability
Real-time tracking tools make it easier to identify which products are moving quickly and which are tying up resources. For example, QuickBooks Enterprise 2024 (R7 release) includes an Inventory Turnover report that calculates this ratio automatically. It also tracks important details like "Last Sell Date" and "Quantity on Hand", helping you pinpoint items at risk of becoming dead stock. To use this feature, go to "Edit", select "Preferences", then "Items & Inventory", and ensure "Inventory and Purchase Orders are Active" is enabled.
Impact on Inventory Optimization
Your turnover ratio can have a direct impact on your profitability. Inventory carrying costs can range from 20% to 30% of your total inventory value annually. By improving turnover, you can cut these costs by up to 30%. But balance is key - while a high turnover ratio often indicates strong sales and efficient stock management, going too high could mean you're running the risk of stockouts.
To put it in perspective, grocery stores typically have turnover ratios of 8–12, while industrial equipment businesses average 2–5. Use this data to guide decisions, such as discounting slow-moving products to free up cash or adjusting prices on high-demand items to boost margins.
Integration with QuickBooks Desktop
For businesses using QuickBooks Desktop, Rapid Inventory offers seamless integration. Its two-way sync ensures that turnover calculations stay accurate by reflecting real-time stock levels across all locations. Features like mobile barcode scanning help automate data entry, reducing errors that could distort your metrics. You can also filter reports using the "Hide Zero Quantity-on-Hand" option or analyze seasonal trends by setting specific date ranges. These tools make it easier to refine your inventory strategies continuously.
Relevance to Preventing Stockouts and Improving Efficiency
Tracking turnover trends allows you to maintain a balance between lean inventory and product availability. For example, in February 2026, Rich Products Corporation implemented a real-time WLAN data collection system with SAP. This provided instant visibility into pallet movements and material tracking, reducing overstock and stockouts, improving recall efficiency, and eliminating delays during peak seasons. Similarly, Target leveraged machine learning to analyze sales data and real-time transactions, cutting down on both excess inventory and out-of-stock issues across its stores.
As Peak Technologies highlights:
"The hidden power of increasing inventory turnover lies not only in cost savings - a 30% reduction of inventory holding costs is possible - but also in a company's ability to outpace rivals, weather uncertainty, and seize opportunities".
sbb-itb-19ed50f
6. Cost of Goods Sold (COGS)
Cost of Goods Sold (COGS) is a cornerstone metric for evaluating inventory performance and overall profitability.
At its core, COGS represents all direct costs involved in producing or purchasing goods - this includes materials, labor, and other related expenses. It’s the foundation for calculating gross profit by subtracting COGS from total revenue. Without precise COGS data, decisions around pricing and profitability become a guessing game.
Real-Time Tracking Capability
Real-time tracking takes financial monitoring to the next level. In QuickBooks, COGS updates automatically with every transaction, ensuring that your Profit and Loss statement reflects the latest data without requiring manual updates. For a closer look at item-specific details, the "Sales by Item" report provides insights into both COGS and gross margins.
Impact on Inventory Optimization
COGS plays a significant role in improving inventory turnover and operational efficiency. As Sage explains:
"Understanding and optimising your inventory turnover ratio can help you improve cash flow, reduce waste, and increase profitability".
For a business generating $1.25 million in revenue, even a 2% reduction in COGS could save $50,000 annually. This can be achieved by cutting redundant SKUs or negotiating better deals with suppliers. Alerts for low stock levels can also prevent tracking errors and ensure smoother operations.
Integration with QuickBooks Desktop
QuickBooks Desktop offers seamless integration to keep your inventory and financial data in sync.
With Rapid Inventory, a two-way sync powered by the QuickBooks Web Connector ensures that every sale, purchase, or inventory adjustment automatically updates COGS, income, and inventory values in real time. This automation reduces the risk of manual errors. To maintain accurate COGS calculations, it’s essential to include a unit cost for every inventory purchase.
Preventing Stockouts and Enhancing Efficiency
Accurate COGS data is key to setting dynamic reorder triggers, which help maintain precise inventory levels and prevent stockouts. By understanding the cost and sales velocity of each product, you can base reorder points on real usage patterns instead of rough estimates. This is especially important given that 44% of inventory-handling companies struggle to balance overstocking and understocking. Additionally, stockouts can cost businesses up to 4% of their annual sales. Regular cycle counts ensure that physical inventory matches system records, keeping reorder points accurate and avoiding costly mistakes.
7. Gross Profit Margin
Gross Profit Margin measures the percentage of revenue left after covering direct product costs. It’s a clear indicator of how effective your pricing strategy is at driving profitability. The formula is simple: (Gross Profit ÷ Revenue) x 100. While metrics like COGS (Cost of Goods Sold) focus on cost efficiency, Gross Profit Margin provides a broader view of how well your product pricing supports your business operations.
On average, Gross Profit Margins hover around 36% across industries, but this varies significantly by sector. For instance, software companies often achieve margins as high as 72.38%, while auto and truck manufacturers average closer to 11.11%. In retail, businesses aim for a Gross Margin Return on Investment (GMROI) of 3.2 or higher to cover expenses and ensure profitability.
Real-Time Tracking Capability
Tracking Gross Profit Margin in real time can be a game-changer. Monitoring SKU-level performance helps identify top-selling products and underperformers quickly, enabling you to adjust pricing strategies to protect profitability.
Dan Cakora, Pricing Economist at Vendavo, emphasizes the importance of this approach:
"Agility and discipline are paramount in an uncertain environment defined by margin pressure and constrained supply".
Impact on Inventory Optimization
Gross Profit Margin analysis plays a critical role in inventory management. It highlights which products are worth the investment in storage and which ones are not. By focusing on faster-selling, higher-margin items and phasing out slower-moving stock, businesses can cut holding costs by 12–18% within just 90 days. Real-time tracking also helps identify dead stock - products sitting in storage without generating sales. Acting quickly by running clearance sales or bundling these items can free up capital and reduce waste.
Take Semaine Health, for example. In 2025, they revamped operations across their U.S. fulfillment centers, reducing shipping times, lowering fulfillment expenses, and significantly cutting error rates. These changes boosted their profit margins and increased order volume.
Integration with QuickBooks Desktop
QuickBooks Desktop simplifies monitoring Gross Profit Margin with built-in reporting tools and customizable dashboards. Add-ons like Rapid Inventory enhance these capabilities by syncing sales data with actual costs, offering real-time margin updates. Regularly running reports on SKU usage and seasonality helps optimize supply chains and set accurate stock alerts. QuickBooks Enterprise even allows businesses to automate reorder points based on sales trends and margin performance, ensuring high-demand products are always available.
Preventing Stockouts and Improving Efficiency
Accurate margin tracking does more than boost profitability - it ensures your business has the cash flow needed for timely inventory replenishment, reducing the risk of stockouts. By combining demand forecasting with point-of-sale data, businesses can cut out-of-stock events by up to 20% in just one quarter. Regular cycle counts also help reconcile physical inventory with QuickBooks records, keeping reorder points accurate and minimizing discrepancies.
Tracking Gross Profit Margin alongside turnover rates enables smarter pricing and promotion decisions, ensuring you’re not just selling more but selling profitably. This approach helps maintain a balance between product availability and financial health, setting your business up for long-term success.
8. On-Hand Inventory Levels
On-hand inventory levels form the backbone of real-time inventory reporting. This metric gives you the exact quantity of stock available in your warehouses, making it essential for smooth order fulfillment and effective purchase planning. Without accurate on-hand data, managing stock efficiently becomes a guessing game.
The stakes are high. Retailers lose an estimated $1.73 trillion annually due to inventory inaccuracies, including both stockouts and overstocking. On top of that, 31% of customers abandon their carts when a product is unavailable, and each stockout can cause a 4% drop in sales.
Real-Time Tracking Capability
Real-time tracking takes the uncertainty out of inventory management. Using tools like barcode scanning, businesses can instantly update stock levels whenever a sale is made or a shipment arrives. This real-time visibility ensures you know exactly what’s available at any given moment, helping businesses meet about 90% of promised delivery dates.
This capability also helps calculate "Available to Promise" (ATP) stock - essentially the inventory left after accounting for customer commitments - so you can avoid overselling.
Impact on Inventory Optimization
Tracking on-hand stock accurately isn’t just about knowing what you have - it’s about smart financial management. Retailers face annual carrying costs of 15% to 30% of total inventory value. Monitoring slow-moving items allows you to take action, like running clearance sales or creating bundle deals, before products become outdated.
Using real-time point-of-sale data and demand forecasting can reduce out-of-stock events by as much as 20% in just one quarter. Leading businesses achieve inventory accuracy rates above 98% and keep inventory write-offs under 1% of total value. These high standards also improve other metrics like stock turnover and cycle count accuracy.
Integration with QuickBooks Desktop
QuickBooks Desktop, when paired with Rapid Inventory, makes tracking on-hand levels seamless. QuickBooks Desktop Enterprise includes tools like barcode scanning, sales order management, and advanced pricing rules. The Platinum and Diamond editions even offer features like serial number and bin location tracking.
Rapid Inventory takes it further by syncing with QuickBooks in real time. This two-way sync ensures on-hand quantities are updated across all locations without delays. Mobile barcode scanning eliminates the lag of batch updates, and real-time reports provide instant visibility for multiple warehouses.
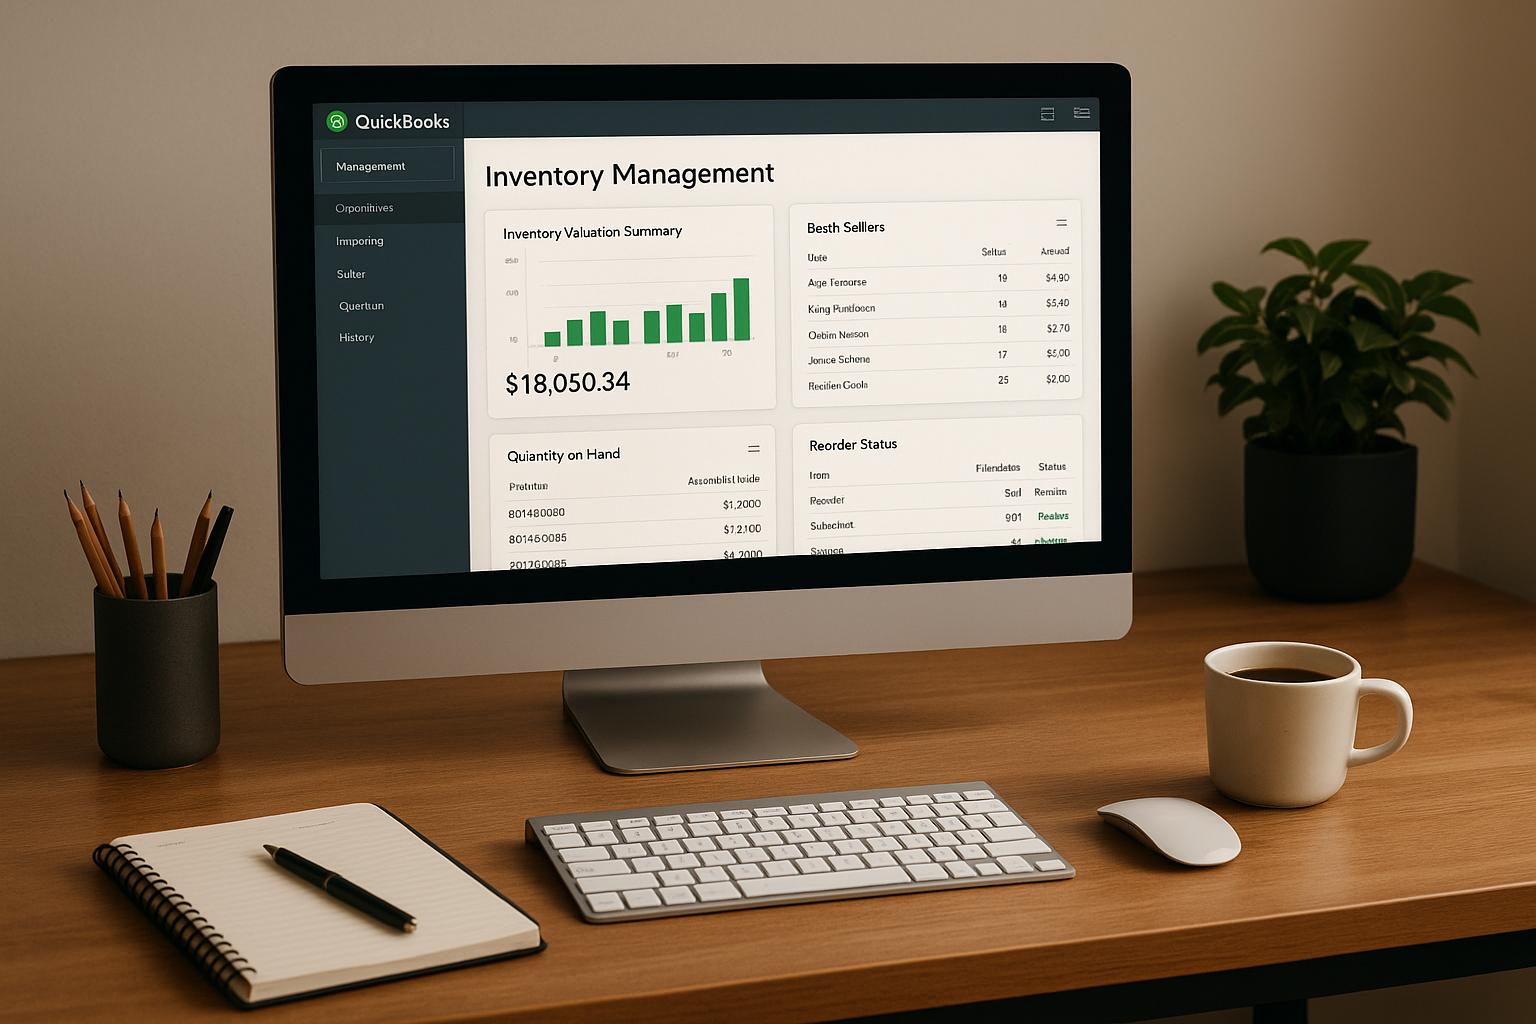
QuickBooks also automates alerts at preset reorder points. The "Inventory Valuation Summary" report gives you a clear view of quantity, value, and average cost for each product. Regular cycle counts maintain accuracy without disrupting daily operations.
Relevance to Preventing Stockouts and Improving Efficiency
Real-time tracking ensures automated alerts are triggered whenever stock hits reorder points. This system keeps supplies replenished and prevents stockouts. It also reduces inflated carrying costs and avoids customer dissatisfaction.
To calculate reorder points, you can use this simple formula: (Average Daily Usage × Average Lead Time in Days) + Safety Stock. For fast-moving items, real-time tracking allows you to reposition them closer to staging areas in the warehouse, cutting down picking time and speeding up fulfillment. Regular cycle counts catch discrepancies early, while QuickBooks’ FIFO method ensures inventory levels reflect actual movement.
9. Backorder Rate
Tracking your backorder rate is a key component of managing inventory effectively, especially when dealing with stockouts and reorder points.
The backorder rate reflects the percentage of customer orders that can't be fulfilled immediately due to insufficient stock. To calculate it, divide the number of delayed orders by the total orders placed, then multiply the result by 100. Ideally, this rate should stay below 5%, while anything above 10% signals serious issues that need immediate attention.
Backorders come with hidden costs, ranging from $15 to $20 per order, due to factors like customer service and complaint resolution. Beyond the financial impact, the customer experience takes a hit - 60% of shoppers will turn to a competitor after one bad delivery experience, and 37% will stop buying from your brand altogether if delays persist. Even a single backorder can lead to a 2.1% drop in that customer’s orders over the next year.
Real-Time Tracking Capability
Real-time tracking is essential for managing backorders effectively. It ensures that your finance team, warehouse staff, and management all have access to the same up-to-date information. With this level of visibility, you can dynamically allocate inventory across multiple fulfillment sources, reducing the risk of both stockouts and excess inventory.
For example, QuickBooks Desktop offers a feature where hovering over the quantity field in any transaction instantly shows current stock and on-order quantities. Additionally, the "Open Purchase Order Detail" report helps track items that are still on order versus those already received. These tools make it easier to monitor inventory in real time, laying the groundwork for seamless integration with QuickBooks Desktop.
Integration with QuickBooks Desktop
Rapid Inventory enhances QuickBooks by offering two-way syncing and real-time backorder tracking workflows. Features like mobile barcode scanning automatically update inventory levels as items are shipped, while real-time reports provide visibility across multiple warehouses. This integration eliminates the need for manual spreadsheet updates, enabling managers to make decisions based on accurate, real-time data.
Relevance to Preventing Stockouts and Improving Efficiency
Monitoring backorder rates goes hand-in-hand with other metrics to address delays that affect stock replenishment and customer satisfaction. Inventory replenishment triggers can help prevent backorders, and reviewing metrics quarterly ensures reorder points remain accurate, especially during seasonal changes (see Section 4 for the Reorder Point formula).
You can also analyze backorder rates by supplier or fulfillment partner to pinpoint reliability issues and adjust order routing as needed. High-performing operations maintain inventory accuracy above 98%, ensuring the reliability of backorder data. Even a 5% reduction in your backorder rate can result in a 15% boost to customer satisfaction.
10. Cycle Count Accuracy
Cycle count accuracy measures how well your physical inventory matches the records in your inventory system. This metric is the backbone of consistent inventory management, as it directly impacts reporting and decision-making. Wasp Barcode Technologies explains it well:
"If what's in your database doesn't match what's on the shelf, you've got a visibility problem. This is the foundation for reliable operations and confident decision-making".
To calculate it, you simply compare the physical stock in your warehouse to the quantities recorded in your system. High-performing operations rely on strong cycle count accuracy to avoid issues like stockouts, overstocking, or errors in financial reporting.
Real-Time Tracking Capability
Real-time tracking takes cycle counting from a periodic task to a continuous, integrated process. Tools like barcode scanners, RFID tags, and IoT-enabled sensors instantly update stock levels, reducing manual errors. With software dashboards, discrepancies become visible immediately, allowing managers to address them quickly. Unlike annual inventory counts that often require shutting down operations, real-time cycle counting happens seamlessly during everyday activities like restocking or fulfilling orders. This method also supports ABC analysis, where high-priority "A" items are counted more frequently. Multi-channel synchronization ensures that inventory updates occur in real time across all platforms, whether in a warehouse or an online store.
Integration with QuickBooks Desktop
QuickBooks Desktop takes real-time tracking a step further by integrating cycle counting into its Advanced Inventory module, available in the Enterprise Platinum and Diamond editions. Mobile scanners connect directly to QuickBooks, letting warehouse staff send counts to the system instantly. QuickBooks Advanced ProAdvisor Raeann Salter highlights:
"Cycle counting is an essential inventory management technique in QuickBooks Enterprise that helps businesses maintain accurate stock levels without full physical inventory counts".
The system automatically adjusts inventory levels and values based on discrepancies found during cycle counts. This ensures financial reports align with actual stock levels, eliminating the need for manual updates. For instance, the "Inventory Stock Status by Item" report uses cycle count data to show current stock, items promised to customers, and orders from vendors. Running a "Negative Inventory Listing" report helps catch potential issues early - ideally, this report should show no discrepancies. Tools like Rapid Inventory enhance this process by integrating mobile barcode scanning with QuickBooks Desktop, ensuring real-time updates for both inventory and financial records.
Relevance to Preventing Stockouts and Improving Efficiency
Accurate cycle counts are key to avoiding the visibility gaps that lead to stockouts and inefficiencies. If your system records don’t match actual inventory, automated reorder points might fail, causing delays in replenishment. Cycle counts help identify problems like theft, damaged goods, or mishandled returns that can disrupt accuracy. Before implementing automated systems, it’s essential to establish a solid baseline with a thorough physical inventory count. Using real-time data to analyze trends - whether related to vendor errors, problematic storage areas, or seasonal changes - enables businesses to fine-tune reorder points and streamline operations. Regularly calibrating tools like RFID readers, handheld scanners, and IoT sensors also ensures data accuracy. High cycle count accuracy not only prevents stockouts but also boosts overall inventory efficiency.
Conclusion
Tracking these 10 metrics takes the guesswork out of decision-making and replaces it with solid, data-backed strategies. By keeping an eye on these KPIs, you can reshape how you handle procurement, inventory replenishment, and customer service. As Wasp Barcode Technologies wisely puts it:
"You can't fix what you don't measure. And when it comes to inventory, the right KPIs help you spot issues before they become expensive problems".
These metrics do more than just streamline inventory management - they also enhance overall operational efficiency. They help prevent stockouts and overstocking while directly influencing your bottom line. For instance, tracking carrying costs and deadstock rates exposes hidden expenses that tie up valuable capital. Meanwhile, metrics like Days' Sales of Inventory and inventory turnover ratios show how effectively you’re converting inventory into cash, which is crucial for maintaining liquidity. On average, small business owners can reclaim 9 hours per week, allowing them to focus on strategic growth instead of tedious manual processes.
For QuickBooks Desktop users, Rapid Inventory offers a seamless solution to bridge the gap between warehouse operations and financial records. Its two-way sync eliminates manual data entry, ensuring that every action - whether it’s picking, receiving, or counting - updates your records instantly. With features like multi-location tracking, mobile barcode scanning for perfect picking accuracy, and built-in workflows for tasks like cycle counting and backorder management, the platform provides the visibility essential for effective monitoring. Advanced QuickBooks ProAdvisor Susan Hawkins highlights:
"The key to using QuickBooks to track inventory successfully is in appreciating how and why QuickBooks tracks all inventory activity at the item/product level".
To get started, focus on three to four KPIs that address your most pressing challenges and review them weekly. Begin by conducting a thorough physical inventory count to establish a baseline, then transition to real-time tracking. Once your system is in place, tools like automated reorder reports and real-time dashboards turn these metrics into actionable insights.
Rapid Inventory’s onboarding process is quick and efficient, taking just 6–7 days with white-glove migration services and dedicated support. Pricing starts at $90 per user/month for the Pro plan (1-9 users) and $900 per month for the Unlimited plan (10+ users, including custom reports and a dedicated account manager). This investment equips businesses with the tools they need to monitor these critical metrics and make smarter decisions.
FAQs
Which 3–4 inventory KPIs should I start tracking first?
To get a handle on your inventory management, start by keeping an eye on three essential metrics: inventory turnover, days' sales of inventory (DSI), and stockout rate. These numbers tell you how effectively your inventory is being managed, how fast products are moving, and how often you're running out of stock. By tracking these KPIs, you can make smarter decisions to boost inventory flow, maintain liquidity, and ensure products are consistently available for customers.
How often should I review and update reorder points?
Reorder points should be reviewed every 30 to 60 days or whenever key factors shift, such as sales velocity, seasonality, or supplier lead times. These regular updates ensure you maintain the right inventory levels, avoiding the risks of stockouts or overstocking.
How do I keep QuickBooks Desktop inventory counts accurate in real time?
To keep your inventory counts precise in QuickBooks Desktop, start by enabling inventory tracking. This feature ensures stock levels are automatically updated when you record purchases, sales, or adjustments. It's also important to conduct regular physical inventory counts and compare those numbers with your QuickBooks records to catch any inconsistencies.
Leverage inventory reports, such as the "Inventory Valuation Summary", to identify and address discrepancies quickly. If you need more advanced features, consider tools like Rapid Inventory. These tools provide real-time tracking, barcode scanning, and support for managing inventory across multiple locations, making the entire process smoother and more efficient.