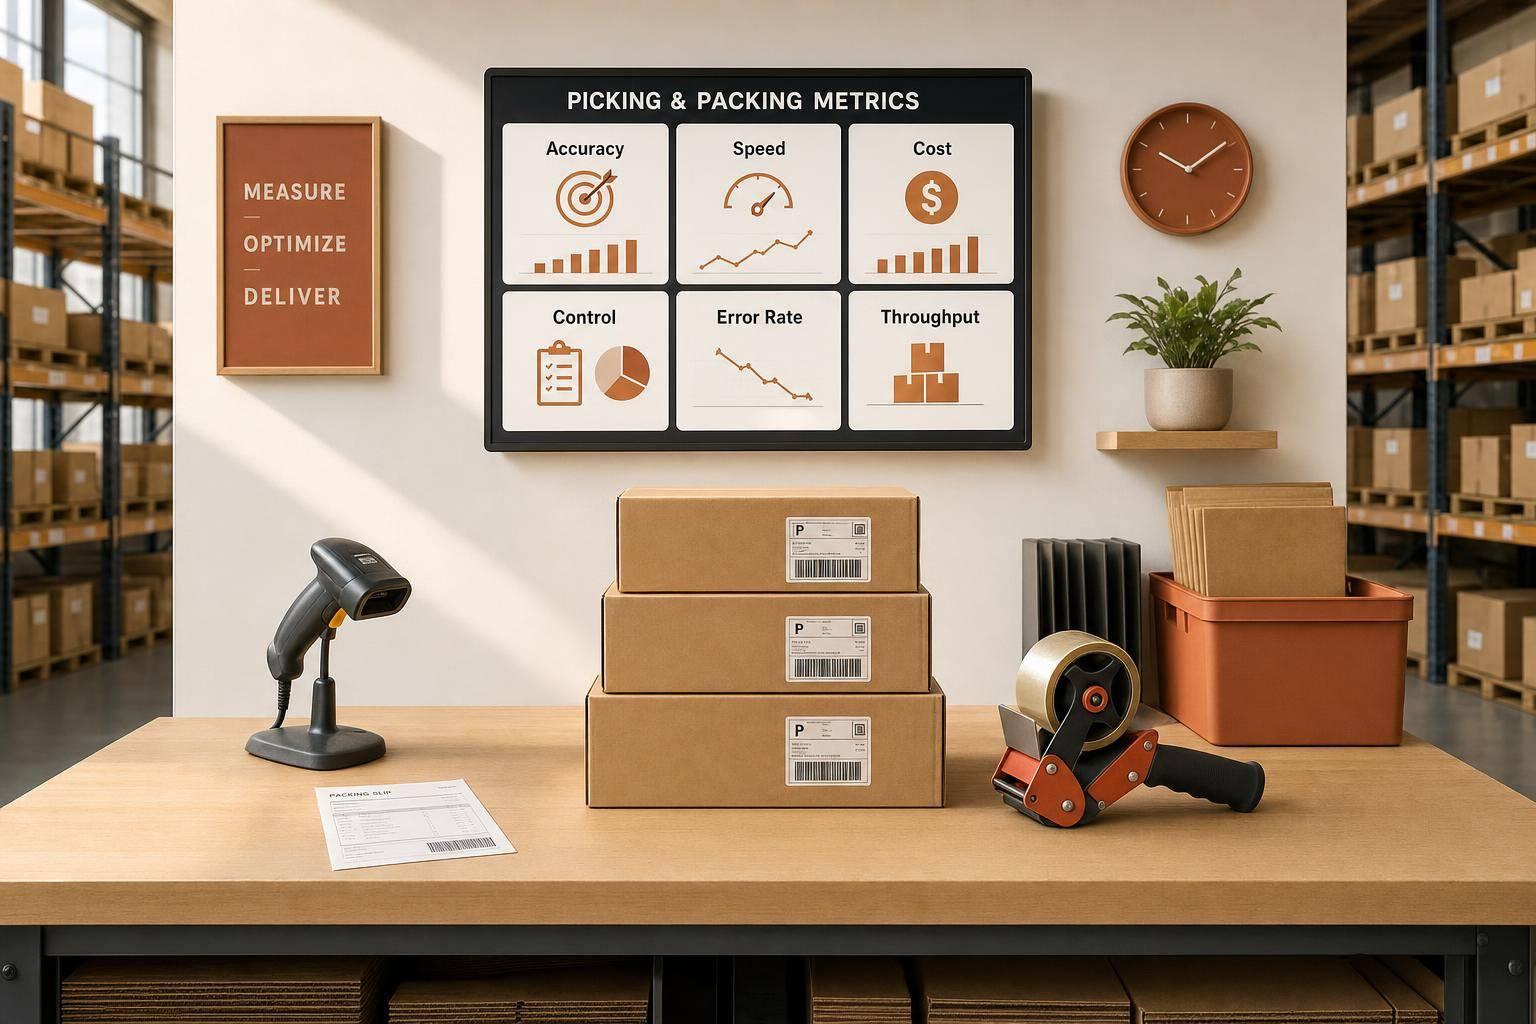
If you want fewer shipping mistakes and lower warehouse cost, track a small set of picking and packing KPIs every day. I’d focus first on pick accuracy, lines per hour, order cycle time, on-time shipping, cost per order, and inventory accuracy. Those six numbers show whether orders move out fast enough, correctly, and at a cost you can control.
Here’s the short version:
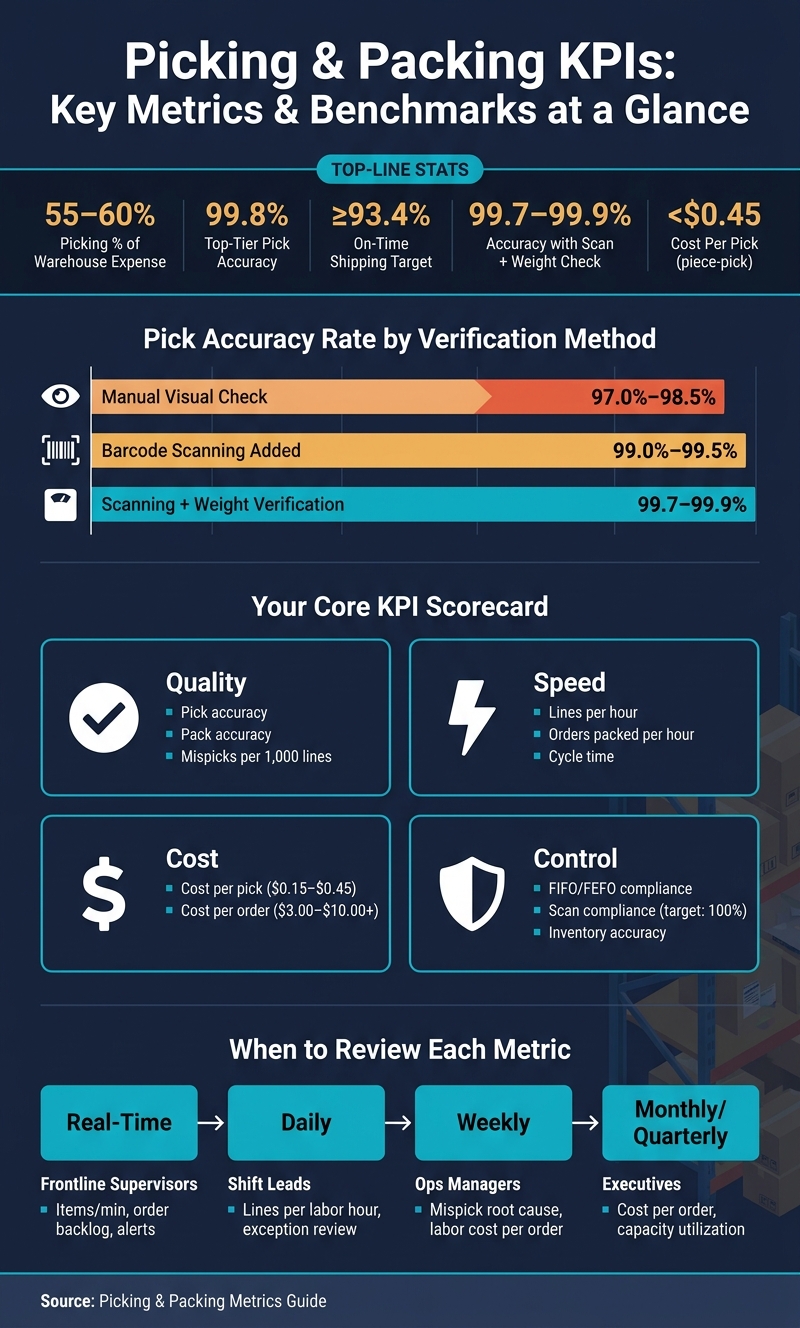
- Picking can drive 55%–60% of warehouse expense
- Top pick accuracy can reach 99.8%
- On-time shipping target starts around 93.4% or higher
- Barcode scanning can push accuracy from 97.0%–98.5% up to 99.0%–99.5%
- Scanning plus weight checks can reach 99.7%–99.9%
If I were setting up a scorecard, I’d keep it simple:
- Track quality: pick accuracy, pack accuracy, mispicks per 1,000 lines
- Track speed: lines per hour, orders packed per hour, cycle time
- Track cost: cost per pick, cost per order
- Track control: FIFO or FEFO compliance, scan compliance, inventory accuracy
- Track by site: compare warehouses with normalized measures like lines per labor hour and cost per order
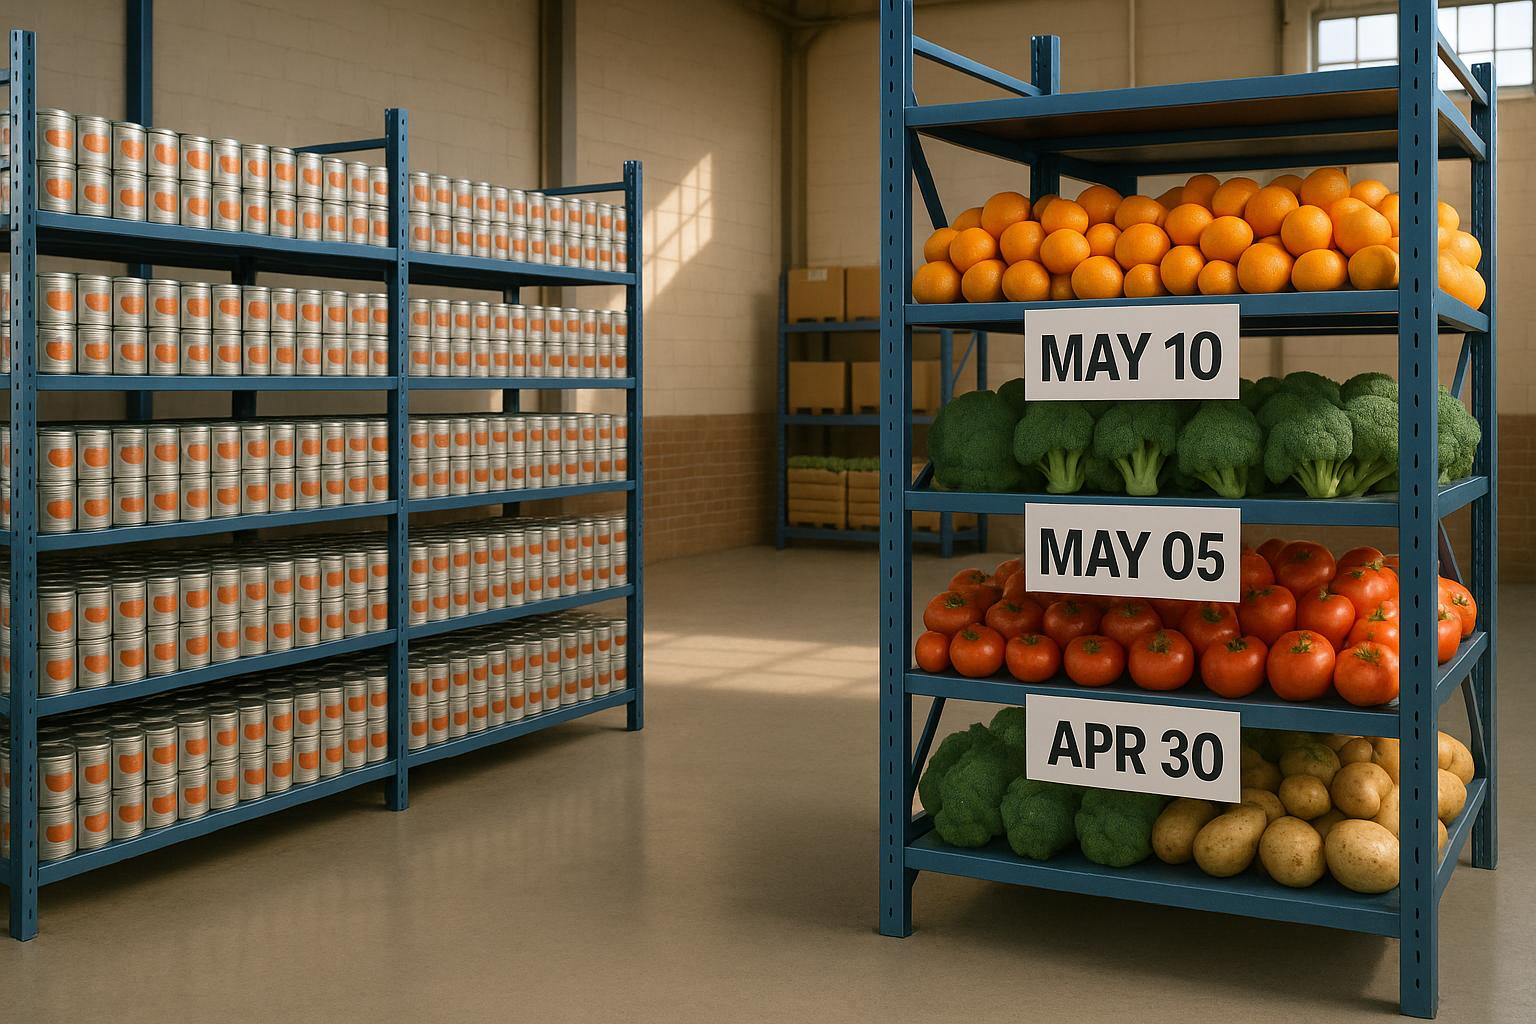
For warehouses with lot, serial, or expiry control, I’d also watch FIFO/FEFO compliance and manual override rate. A fast process does not help much if the wrong lot ships or if expired stock goes out.
Picking & Packing KPIs: Accuracy Benchmarks by Method
What Is Throughput In Warehouse Picking And Packing? - Smart Logistics Network
sbb-itb-19ed50f
Quick comparison
| Area | What I’d measure | What it shows |
|---|---|---|
| Picking | Accuracy, lines per hour, mispicks, cost per pick | Whether items are picked correctly and fast enough |
| Packing | Pack accuracy, orders per hour, carton use, cost per order | Whether shipments leave complete and on time |
| FIFO/FEFO | Compliance rate, reshipment rate | Whether stock rotation rules are followed |
| Scanning | Scan compliance, timestamped pick events | Whether data is clean and errors are blocked at the bin |
| Multi-site | Cost per order, cost per pick, line accuracy by location | Whether one warehouse is falling behind another |
The main idea is simple: use the same formulas, the same units, and the same review schedule every time. That gives you numbers you can trust from shift to shift, and from one warehouse to another.
Key picking and packing metrics: formulas and sample benchmarks
Picking metrics: accuracy, productivity, cycle time, errors, and cost
These formulas and benchmarks help turn high-level KPIs into targets the floor team can actually use. The tables below translate those KPIs into day-to-day operating goals and benchmark ranges.
| Metric | Formula | Sample Benchmark |
|---|---|---|
| Picking Accuracy | (Correct lines picked ÷ Total lines picked) × 100 | 99.8% top-tier benchmark |
| Lines per Hour | Total lines picked ÷ Total picking hours | Varies by picking method |
| Pick Cycle Time | Time of pick completion − Time of order release | Under 4–8 hours for internal targets |
| Mispicks per 1,000 Lines | (Total errors ÷ Total lines picked) × 1,000 | < 2 errors per 1,000 lines |
| Cost per Pick | Total picking labor cost ÷ Total lines picked | $0.15–$0.45 in piece-pick environments |
One quick note: pick rate means very little without accuracy. A fast picker who creates more errors can slow down the whole operation once rework, customer complaints, and reshipments start piling up.
Packing metrics: accuracy, throughput, cycle time, and cost per order
Packing accuracy is the last checkpoint before a shipment leaves the building. That makes packing metrics a simple way to measure how well this step performs on both quality and cost.
| Metric | Formula | Sample Benchmark |
|---|---|---|
| Packing Accuracy | Correctly packed orders ÷ Total orders packed × 100 | > 99.8% |
| Orders per Labor Hour | Total orders packed ÷ Total packing hours | 20–60+ depending on order complexity |
| On-Time Ship Rate | (Orders shipped on time ÷ Total orders) × 100 | ≥ 93.4% |
| Packing Cost per Order | Total packing labor and materials cost ÷ Total orders packed | $3.00–$10.00+ depending on industry and order size |
| Carton Utilization | (Product volume ÷ Total carton volume) × 100 | 75%–85% |
A smart control point to add at the packing station is weight verification. When you compare actual package weight against expected weight, you can catch missing or wrong items without doing a manual recount. It’s one of those checks that can save time while cutting avoidable mistakes.
How often to report each metric
The metric itself matters, but the reporting cadence often decides whether anyone can do something with it. Floor metrics need to stay close to real time so supervisors can step in fast. Cost and trend metrics usually make more sense in weekly or monthly reviews.
| Reporting Frequency | Audience | Key Metrics | Purpose |
|---|---|---|---|
| Real-Time | Frontline supervisors | Items per minute, order backlog, performance alerts when rates fall below baseline | Immediate floor adjustments and congestion prevention |
| Daily | Shift leads / managers | Lines picked per labor hour, daily exception review | Shift-level performance reviews and error correction |
| Weekly | Operations managers | Root-cause analysis of mispicks, labor cost per order, cycle time trends | Spotting process gaps and training needs |
| Monthly / Quarterly | Owners / executives | Cost per order, warehouse capacity utilization | Strategic planning and budgeting |
If you’re working with a smaller team, start simple. Put daily focus on lines per hour and mispicks, then bring packing cost per order into your monthly review once you have a 30-day baseline.
Next, apply these metrics to FIFO, FEFO, and mobile scanning workflows, where picking and packing errors show up first.
Metrics for FIFO, FEFO, and mobile barcode scanning workflows
FIFO and FEFO metrics with workflow examples
When picking rules depend on stock age or expiry, speed alone doesn't tell the full story. If inventory is lot-controlled or date-controlled, you also need compliance metrics that confirm the right stock leaves first.
FIFO (First-In, First-Out) means the oldest received stock ships first. It's the standard method for non-perishables, where the main risk is stock becoming outdated. FEFO (First-Expired, First-Out) sends out the earliest-expiring stock first, which matters most in food, beverage, and pharmaceutical warehouses.
| Workflow | Key Metric | Formula | Sample Benchmark |
|---|---|---|---|
| FIFO | FIFO Compliance Rate | (Correct records ÷ Records checked) × 100 | 99.9% (Best-in-class) |
| FEFO | FEFO Compliance Rate | (Orders picked with earliest expiry ÷ Total orders) × 100 | 98%–100% |
| Serialized inventory | Pick Accuracy (Lot/Serial) | (Correct lot/serial picks ÷ Total picks) × 100 | 99.9%+ |
| Reshipment rate | Replacement shipments from picking errors | (Replacement shipments ÷ Total shipments) × 100 | < 1% |
There's a tradeoff here. Strict FEFO routing can slow pick speed a bit because workers are sent to specific bins instead of the closest available stock. But that slower path can cut rework, expired stock write-offs, and returns.
What mobile scanning data adds to KPI reporting
Paper-based picking confirmation gives you an answer at the end of the shift. Mobile scanning gives you a record at each pick event: SKU, quantity, location, lot number, serial number, and expiry date, all captured with real-time validation.
That changes reporting in a big way. Manual confirmation slows visibility. Scanning gives immediate validation plus a timestamp for each action. In a scan-to-verify workflow, the picker can't move forward if the wrong item or bin is scanned. The mistake has to be fixed on the spot. And when every step has a precise timestamp, cycle time stops being a rough guess and becomes an actual measurement.
Mobile scanning also adds scan compliance rate, which is the share of transactions completed with a scanner instead of a manual override. The target is 100%. Any manual override pokes a hole in FIFO/FEFO data integrity.
The accuracy gap is plain to see. Manual visual checks produce accuracy rates of 97.0%–98.5%. Add barcode scanning to manual picking, and accuracy moves to 99.0%–99.5%. Pair scanning with weight verification, and it reaches 99.7%–99.9%. For lot-controlled or serialized inventory, that difference can mean fewer errors and fewer reshipments.
These event-level records also make it much easier to compare performance across shifts, zones, and locations.
Where Rapid Inventory fits in
Rapid Inventory supports QuickBooks Desktop with FIFO/FEFO picking, lot and serial tracking, mobile barcode scanning, two-way sync, and real-time inventory reports. That same data can support cleaner dashboards for small sites, larger warehouses, and multi-location operations.
Tracking metrics by warehouse size and across multiple locations
Once you’ve set your core metrics, the next move is to match the dashboard to the size of the operation. A small warehouse doesn’t need the same level of detail as a regional DC. If you treat them the same, the dashboard gets noisy fast.
Small warehouses: a lean KPI dashboard
For small teams, 8 to 12 core metrics is usually enough. Any more than that, and the numbers can bury the stuff that matters most. The main ones to watch are picking accuracy, lines per hour, orders packed per hour, pack accuracy, cost per order, and inventory accuracy.
A simple reporting rhythm works best here: a daily execution board that shows yesterday’s orders shipped, current backlog, open receiving and replenishment work, and the biggest exceptions. Then use a weekly summary to spot patterns over time.
Mid-sized and larger single-site warehouses: adding labor detail and process control
As order volume climbs, you need more detail to manage labor and process flow. That usually means adding metrics like mispicks per 1,000 lines, pick cycle time, on-time pick completion, pack first-pass yield, and damage or rework rate.
These numbers help with staffing calls, shift planning, and root-cause work when things go sideways.
Before you compare performance, break results out by shift, zone, and picking method. That step matters. A site-level average can look fine while one shift or zone is struggling.
Multi-warehouse tracking: comparing sites using normalized metrics
When a team runs more than one warehouse, the goal changes. It’s no longer just about tracking one site. It’s about comparing sites in a fair way.
That’s where normalized metrics come in. Use lines picked per labor hour, cost per pick, cost per order, split shipment rate, and line accuracy by location to compare warehouses of different sizes. For an executive-level view, use Perfect Order Rate as the top-line comparison.
Cross-site reporting falls apart when reason codes, SKU masters, or location names don’t match from one facility to another. Keep location data in a consistent Zone–Aisle–Bay–Level–Bin format across every site.
| Warehouse Size | Core Metrics | Reporting Frequency |
|---|---|---|
| Small | Picking accuracy, lines per hour, orders packed per hour, pack accuracy, cost per order, inventory accuracy | Daily checks, weekly summaries |
| Mid-Sized / Large | Mispicks per 1,000 lines, pick cycle time, on-time pick completion, pack first-pass yield, damage/rework rate | Daily execution, weekly trends |
| Multi-Warehouse | Lines picked per labor hour, cost per pick, cost per order, split shipment rate, line accuracy by location | Weekly site comparison, monthly executive scorecard |
Rapid Inventory can consolidate multi-warehouse data into one format for cleaner site-level reporting.
Conclusion: Build a practical scorecard and improve it over time
Use the formulas, benchmarks, and workflows above to turn picking and packing data into a scorecard. Then review that scorecard the same way every week. That consistency matters. If the method keeps changing, the numbers stop being useful.
Key points to carry forward
Start small. Use the smallest set of metrics that covers quality, speed, and cost. Add more only after the core scorecard is steady.
Keep every formula standardized. Use the same definitions across shifts, reporting periods, and sites. If one team measures a metric one way and another team measures it differently, side-by-side comparison falls apart.
Match the review cadence to the decision. Use daily reviews for shift-level issues, weekly reviews for trends, and monthly or quarterly reviews for cost and capacity.
Track compliance and scan validation when traceability risk is high - especially for food, pharmaceuticals, or electronics. If picking accuracy slips or inventory gaps show up, scan validation data can help show where the process is breaking down. For QuickBooks Desktop users, Rapid Inventory provides the scan and lot data needed for that scorecard without manual re-entry.
Normalize before comparing sites. Then segment by shift, zone, or picking method to find the actual cause of the gap, not just the surface-level number.
The best scorecard is the one you can keep steady, compare cleanly, and improve month by month.
FAQs
Which KPI should I fix first?
Start with the metric that dropped the most. First, fix inventory record accuracy, location accuracy, and cycle count accuracy, because bad data throws off replenishment, slotting, and available-to-promise.
Once the data is dependable, turn to customer-facing metrics like order accuracy and cycle time. Look at the step where the process broke down, test a fix, and track the result over one or two cycles.
How do I set realistic KPI targets?
Start with your own historical data instead of leaning only on industry averages. Track metrics like pick accuracy, lines per hour, and order cycle time across a rolling 13-week window. That gives you a better view of seasonality, promotions, and staffing changes as they happen.
Then set targets at a more granular level. Look at performance by warehouse, zone, picking method, shift, and SKU complexity rather than using one facility-wide average for everything. With real-time data from your inventory management system, such as Rapid Inventory, you can spot top-quartile performance and set stretch goals that push the team without feeling out of reach.
When should I add barcode scanning?
Add barcode scanning when pick accuracy keeps slipping below your target. One common reason is simple: there’s no scan check during picking.
Barcode scanning helps confirm SKUs, quantities, and locations as each item is picked. That cuts down on human error and can move accuracy from the usual manual range of 97.0%–98.5% closer to 99.0%–99.5%.
Rapid Inventory supports this with mobile barcode scanning and real-time inventory updates through two-way synchronization.