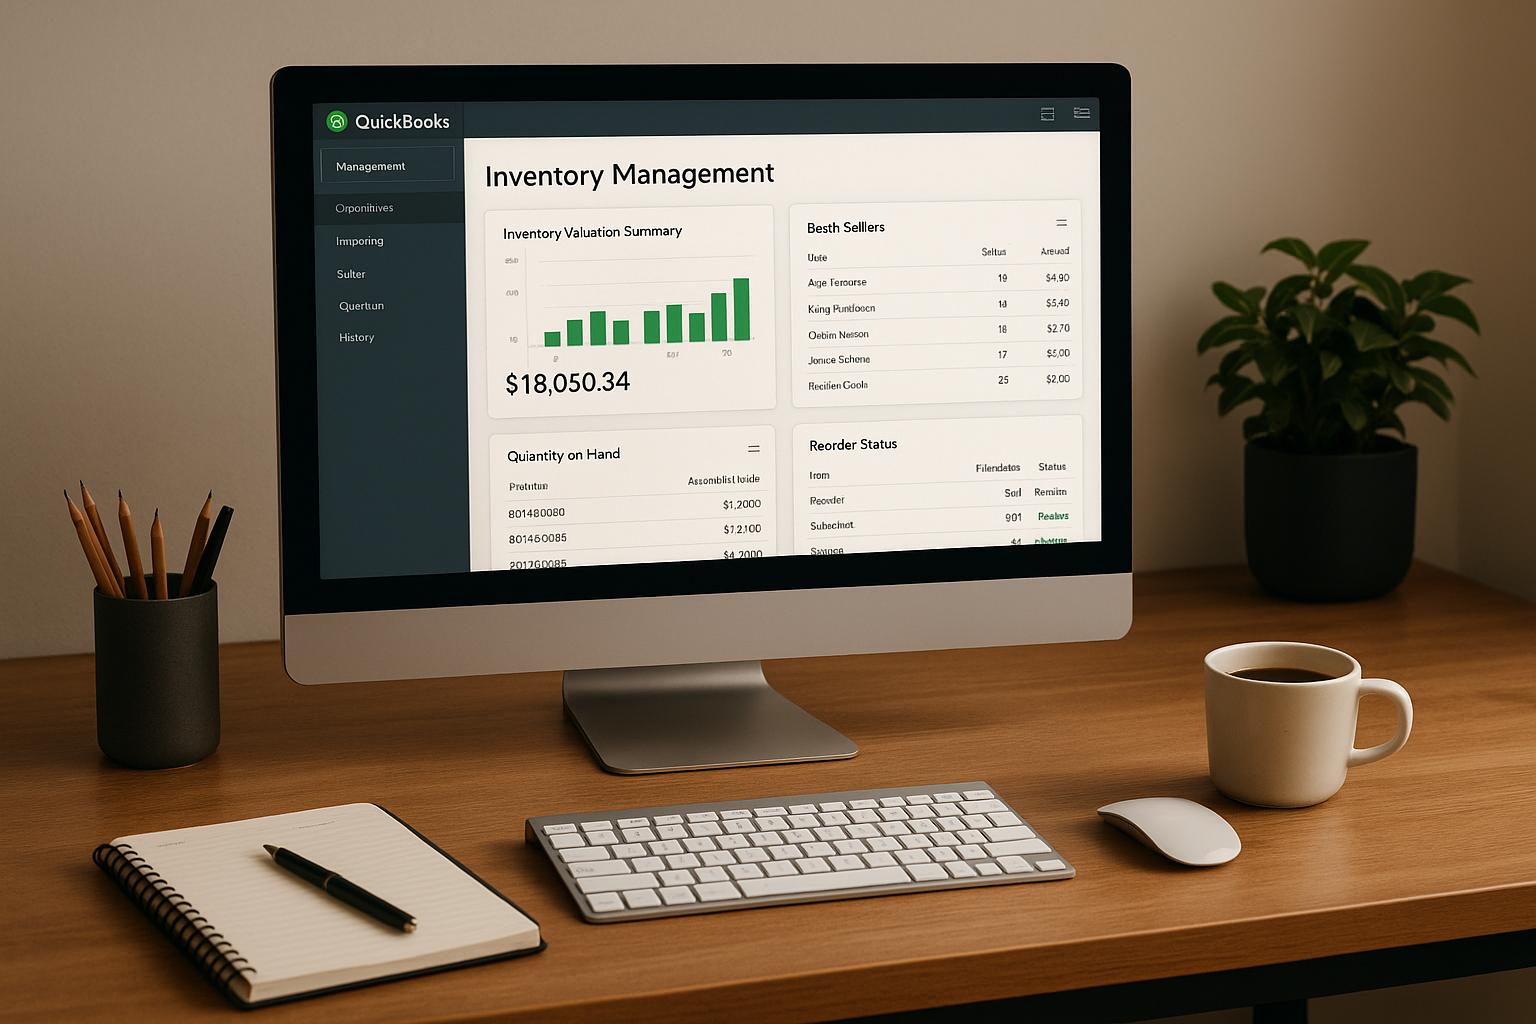
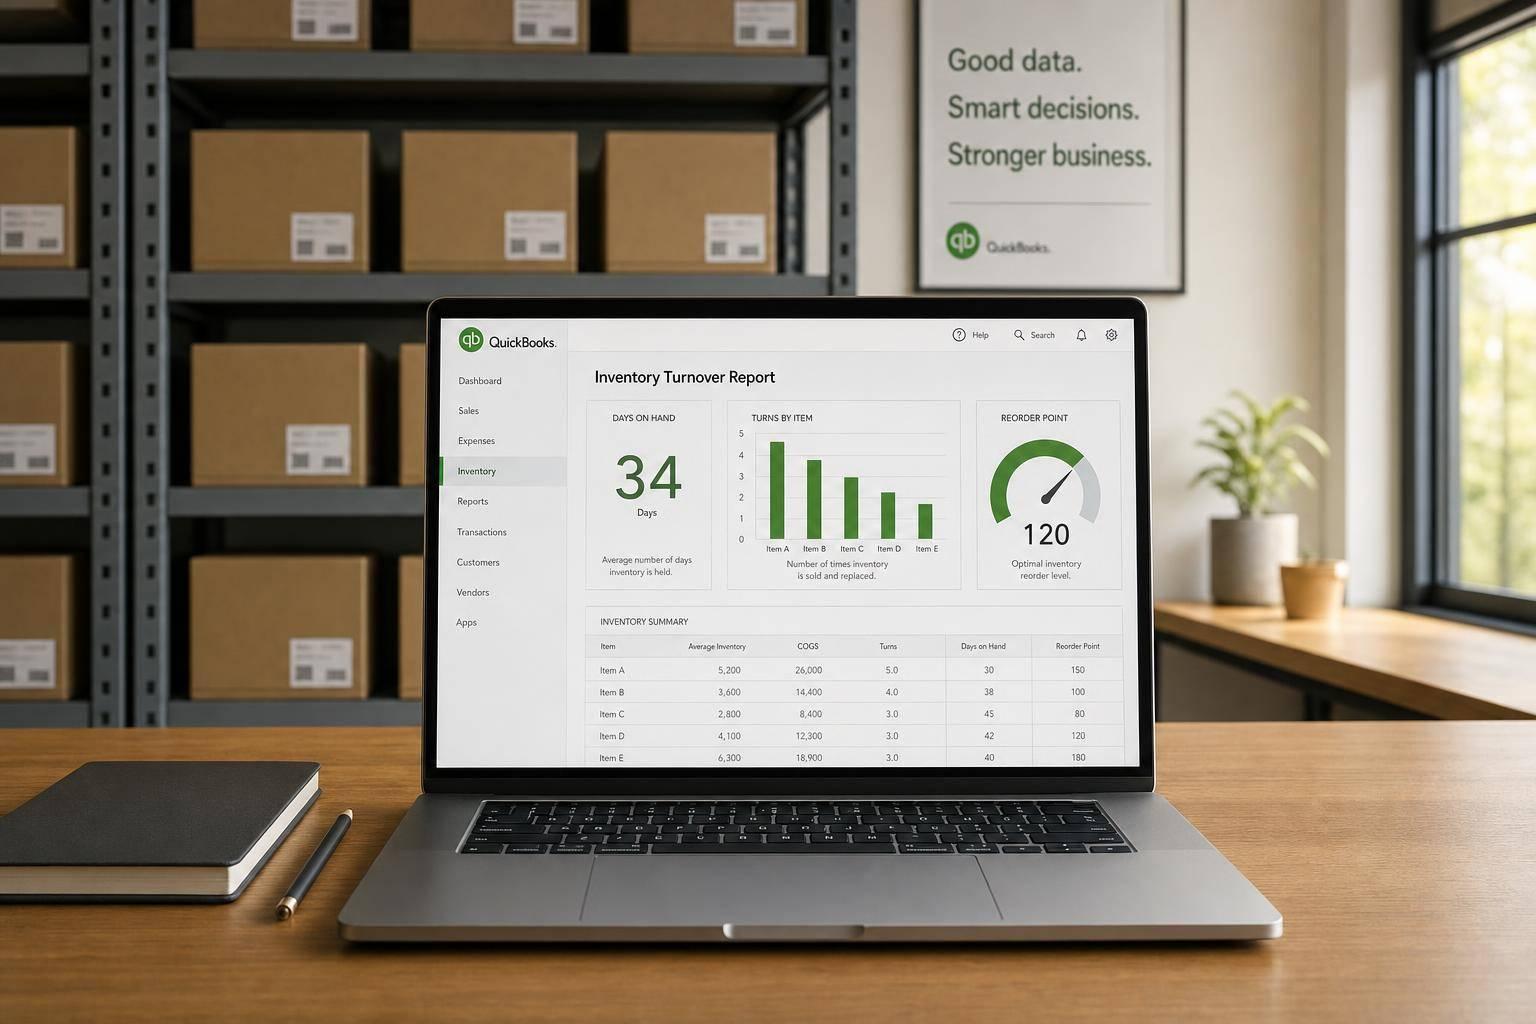
If your turnover report is off, your buying decisions can be off too. I’d treat this report as a cash-control tool: clean up item setup, fix negative stock, count inventory, then read turnover next to lead time, demand, and stockout risk.
Here’s the short version:
- Turnover ratio shows how many times inventory sold and got replaced in a period.
- Days on hand shows how long stock sits. The basic math is 365 ÷ turnover ratio.
- A SKU with 12 turns/year sits about 30 days.
- A SKU with 4 turns/year sits about 91 days.
- Low turns can mean cash tied up, aging stock, storage cost, or write-down risk.
- High turns can look good, but they can also hide stockouts and missed sales.
- In QuickBooks Desktop, the report works best when item costs, COGS, and counts match.
- I’d also check Sales by Item Summary and Inventory Valuation Summary before changing reorder points.
A few takeaways stand out:
- Fix the data first. Wrong item types, stale counts, and negative quantities can skew the report.
- Sort by the lowest turnover first. That’s often the fastest way to spot shelf space and cash problems.
- Convert turns into days. It’s easier to compare days on hand with vendor lead times.
- Use a simple reorder formula:
reorder point = (average daily demand × lead time in days) + safety stock - Watch SKUs with under 1–2 turns per year and over 180 days on hand.
If I were reviewing this report at month-end, I’d focus on one question: Is this item sitting too long, or am I running too lean? That one check can shape purchasing, markdowns, replenishment, and product mix with a lot more confidence.
How to run an Inventory Turnover Report in QuickBooks Desktop Enterprise

sbb-itb-19ed50f
Set Up QuickBooks Desktop for Accurate Turnover Reporting

Your turnover report is only as good as the data behind it. If item setup, costs, or stock counts are off, the report will be off too.
Before you run anything, check the basics in QuickBooks Desktop: inventory settings, item types, and on-hand quantities. It helps to handle this in a simple order. First, make sure inventory tracking is turned on. Then check that your products are using the right item types. After that, review your counts so the numbers in the report match what’s actually on the shelf.
Enable Inventory Features and Prevent Negative Quantity Issues
Once the report metrics are clear, the next step is making sure QuickBooks tracks inventory the right way. Turn on inventory tracking in QuickBooks Desktop, use inventory item types for products you keep in stock, and fix any negative quantities before you run the report.
Negative quantities can throw off both quantity and cost data. That means your turnover numbers may look fine at a glance while hiding bad inputs underneath. If QuickBooks shows stock below zero, clean that up first so the report reflects what you actually had on hand during the period.
Keep Item Costs and COGS Aligned
Item costs, purchase records, and COGS need to line up so inventory value matches what you paid for stock. If those pieces don’t match, turnover reporting can drift fast.
This matters even more if you manufacture goods. In that case, review the cost structure in those item records so the turnover report includes the full direct cost of production, not just part of it.
Count Inventory Regularly Before Using Turnover Metrics
Before using the report, count inventory before the reporting period so beginning and ending balances are current.
That step sounds basic, but it makes a big difference. If your opening or closing counts are stale, your turnover metric can point you in the wrong direction. A fresh count gives QuickBooks a clean starting point and helps the report reflect what actually moved during the period.
How to Run and Customize the Inventory Turnover by Item Report
Run the Report for the Right Date Range and Review the Main Columns
Once your item setup and counts are clean, run the report for the period you want to check. Set the date range first, then look at the turnover ratio before anything else. In QuickBooks, that ratio is COGS ÷ average inventory. A higher ratio means the item is selling through faster.
After that, tighten the view so you can see why the ratio looks the way it does. Focus on the items and conditions behind the numbers instead of scanning the whole report at once.
Customize Columns, Filters, and Sort Order for Better Decisions
Filter the report to the items, classes, or locations you want to review. Then sort by the lowest turnover to spot slow movers fast. That simple change can save time, especially when you’re trying to figure out what’s tying up cash on the shelf.
If a report feels noisy, this is usually the fix. Cut out the extra rows, keep the columns that matter, and sort the data in a way that helps you act on it.
Save Report Views for Month-End and Quarter-End Reviews
When the layout looks right, save it as a memorized report. That way, your month-end and quarter-end view is ready to go the next time you need it.
It’s a small step, but it makes repeat reviews a lot less annoying.
How to Read Turnover Metrics and Act on Them
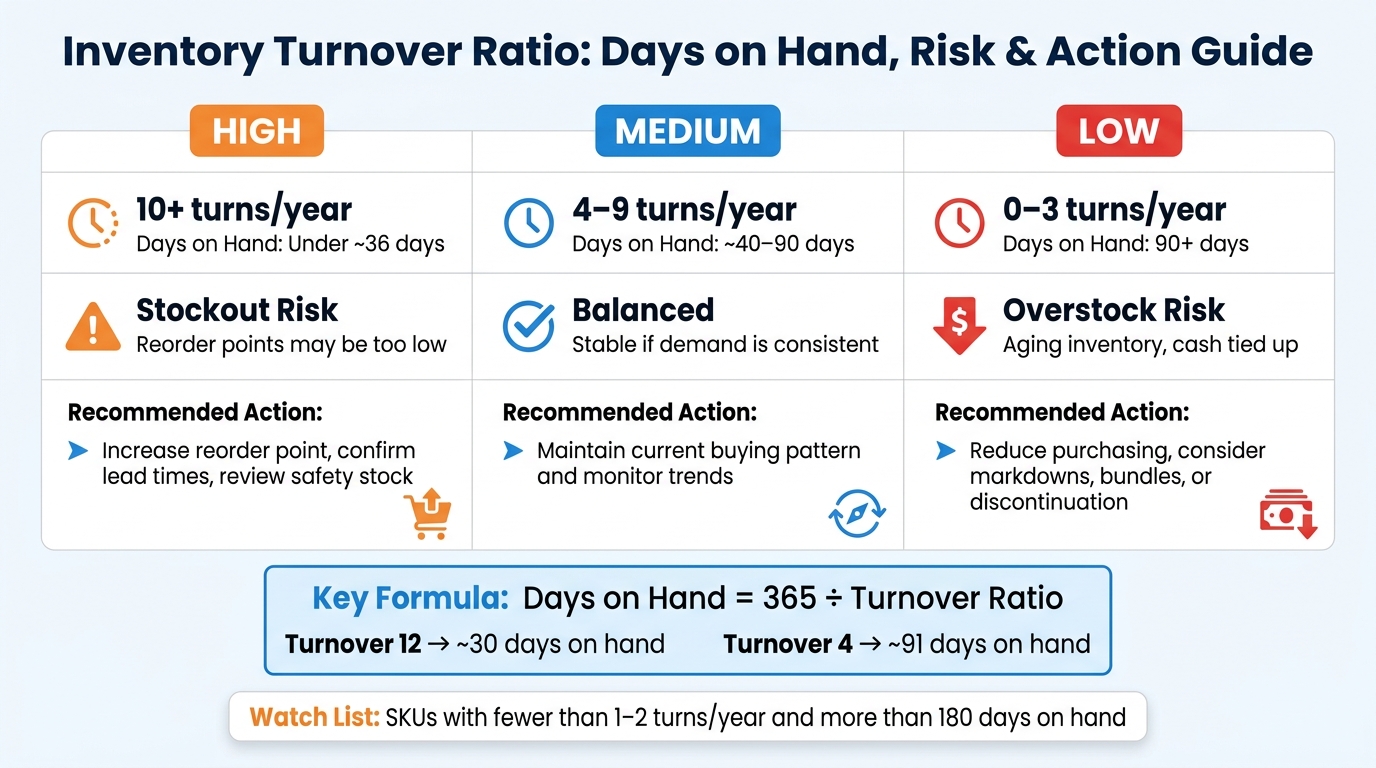
Inventory Turnover Ratio: Days on Hand, Risk & Action Guide
After you run the report, the next step is pretty simple: turn each SKU’s turnover into days on hand, then compare that number with lead time and demand.
Read Turnover Ratio and Turnover Days in Business Terms
Use turnover ratio and days on hand to judge whether each SKU is moving fast enough for its lead time and cash needs. To convert turnover ratio into days on hand, use 365 ÷ turnover ratio.
A ratio of 12 works out to about 30 days on hand. A ratio of 4 comes to about 91 days.
What counts as healthy depends on the item. Food and perishables usually turn 15–20 times per year, or about 18–25 days on hand. Capital goods and replacement parts often sit much longer, with 90–180 days on hand.
Seasonality matters too. A summer item can look slow in January and perfectly fine in June. That’s why it helps to compare the same seasonal period year over year before you make a call.
Use Related QuickBooks Reports to Confirm What the Turnover Report Shows
Don’t read the turnover report in isolation. Use Sales by Item Summary to confirm demand, and use Inventory Valuation Summary to see how much cash each SKU is tying up.
In plain English:
- A fast-moving item usually needs tighter reorder control.
- A slow mover usually needs lower buying levels.
There’s one catch. High turnover doesn’t always mean things are going well. It can also point to stockouts. If an item sells fast because you keep running out, that’s not a win. Check backorders or Sales by Item Detail before treating high turnover as healthy.
Use turnover to figure out which risk matters more for each SKU: too much cash sitting in stock or too little product on the shelf.
| Turnover ratio range | Typical days on hand | Inventory risk | Recommended action |
|---|---|---|---|
| High (10+ turns/year) | Low (generally under ~36 days) | Stockout risk if reorder points are too low | Increase reorder point, confirm lead times, review safety stock |
| Medium (4–9 turns/year) | Moderate (~40–90 days) | Balanced inventory if demand is stable | Maintain current buying pattern and monitor trends |
| Low (0–3 turns/year) | High (often 90+ days) | Overstock, aging inventory, cash tied up | Reduce purchasing, consider markdowns, bundles, or discontinuation |
Adjust Reorder Points, Safety Stock, and Plans for Slow-Moving Items
Once you know whether the problem is stockout risk or excess inventory, adjust your buying rules to match.
Use turnover days as the trigger for reorder-point changes and safety-stock review. If an item turns in 30 days and your vendor also takes 30 days to deliver, you’re cutting it close. You have almost no cushion, so it makes sense to raise the reorder point and add safety stock.
A simple starting formula is:
reorder point = (average daily demand × lead time in days) + safety stock.
For slow movers, start by pausing reorders. Then work through options like markdowns, bundles, or a secondary sales channel before you think about discontinuation.
Pay close attention to SKUs with fewer than 1–2 turns per year and more than 180 days on hand.
If your counts shift every day or you manage stock across more than one location, the next move is keeping the underlying inventory data current.
Use Rapid Inventory to Support More Reliable QuickBooks Turnover Analysis
If your QuickBooks data trails behind what’s happening on the warehouse floor, turnover reports can drift off course. A live inventory workflow helps keep those reports up to date.
Keep Stock Counts Current with Two-Way QuickBooks Sync and Real-Time Workflows
Rapid Inventory connects directly to QuickBooks Desktop with a two-way sync, so quantities, receipts, and adjustments update in both systems as they happen. That matters because turnover depends on COGS from the Profit & Loss report and inventory value from the Balance Sheet.
Instead of waiting until the end of the day to enter stock movement, warehouse teams can record it right away. That cuts down on the lag that can throw off turnover numbers.
When counts stay current, it becomes much easier to review turnover by location and spot where stock is starting to pile up.
Improve Turnover Data with Multi-Location Tracking, Barcode Scanning, and Cycle Counts
A company-wide average can blur the picture. One warehouse may be sitting on too much stock while another is close to running short. Multi-location tracking separates those numbers so you can act on what’s happening at each site.
Mobile barcode scanning helps cut entry mistakes that distort item-level turnover. Pair that with cycle counting - checking part of your inventory on a rolling schedule - and you can keep stock levels in line between full physical counts. It also helps ending inventory stay matched to physical stock.
With cleaner item and location data, month-end turnover reviews take less time and are easier to trust.
Conclusion: Key Practices for Getting More from the Inventory Turnover Report
These workflows help teams review turnover faster and with fewer data issues at both the item and location level. The table below shows how each QuickBooks report ties to a Rapid Inventory workflow.
| QuickBooks report | Supporting Rapid Inventory feature | Planning outcome |
|---|---|---|
| Inventory Turnover by Item | Two-way QuickBooks sync and real-time inventory reporting | More reliable turnover ratios based on current quantities |
| Inventory Valuation Summary | Cycle counting and quantity adjustment workflows | Item counts aligned with inventory value |
| Sales by Item Summary or Detail | Multi-location tracking and mobile barcode scanning | Replenishment decisions made at item and location level |
FAQs
Why is my turnover report inaccurate?
Your inventory turnover report can be wrong if your stock or sales data is wrong. And that happens more often than many teams expect.
Some of the most common causes are:
- incorrect beginning or ending inventory
- unrecorded damaged stock
- Cost of Goods Sold errors
- QuickBooks Desktop data entry mistakes
You can also run into trouble when physical counts don’t match your digital records. Backdated transactions can cause timing problems too, which throws off the numbers.
Rapid Inventory helps improve accuracy with real-time, two-way QuickBooks synchronization.
What is a good inventory turnover ratio?
A good inventory turnover ratio usually falls between 5 and 10. But there’s no one-size-fits-all number. The right range depends on your industry and how your business operates.
For example, grocery stores often land around 12 to 14, while furniture retailers tend to sit closer to 3 to 4. Industrial equipment businesses usually fall between 2 and 5.
The main thing is to compare your ratio against the normal range for your sector. That gives you a clearer read on whether you’re holding too much stock or not enough, so you can keep inventory in line with demand and avoid overstocking or stockouts.
How often should I review turnover by item?
Review turnover reports on a regular schedule, ideally weekly or monthly. A weekly check can help you catch supply chain problems early or spot sudden changes in what customers are buying.
Monthly reviews are often the sweet spot for day-to-day decisions and seasonal analysis. Annual calculations, on the other hand, give you a big-picture view for long-term planning. Many businesses rely on monthly reports to make tactical adjustments and use annual data for benchmarking.