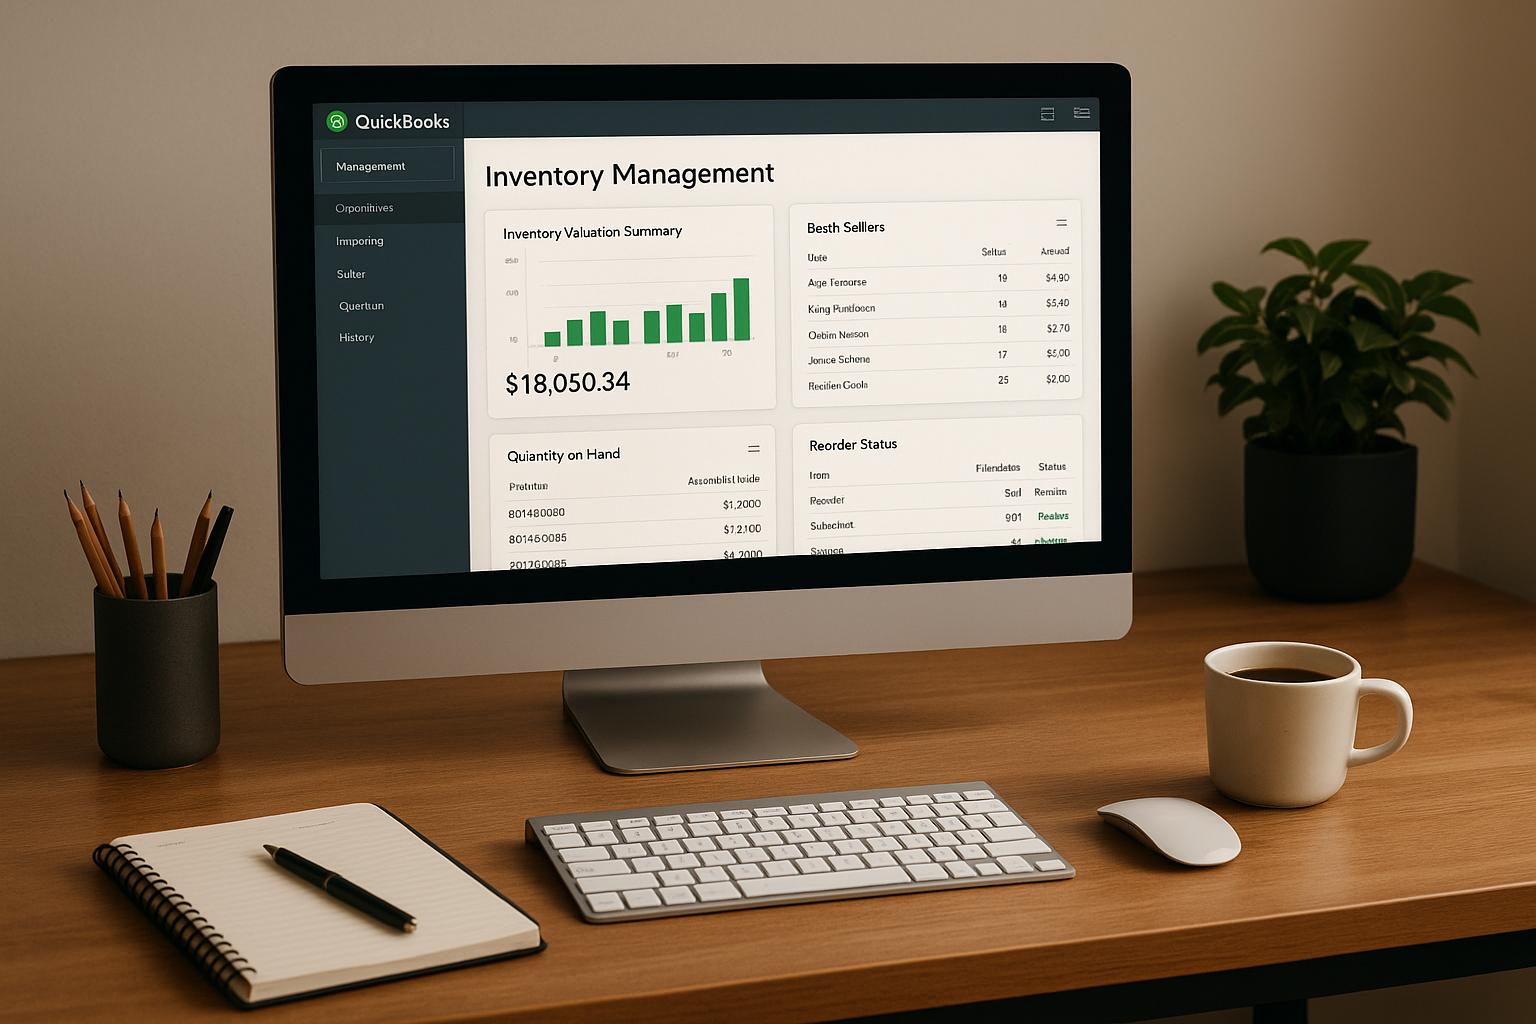
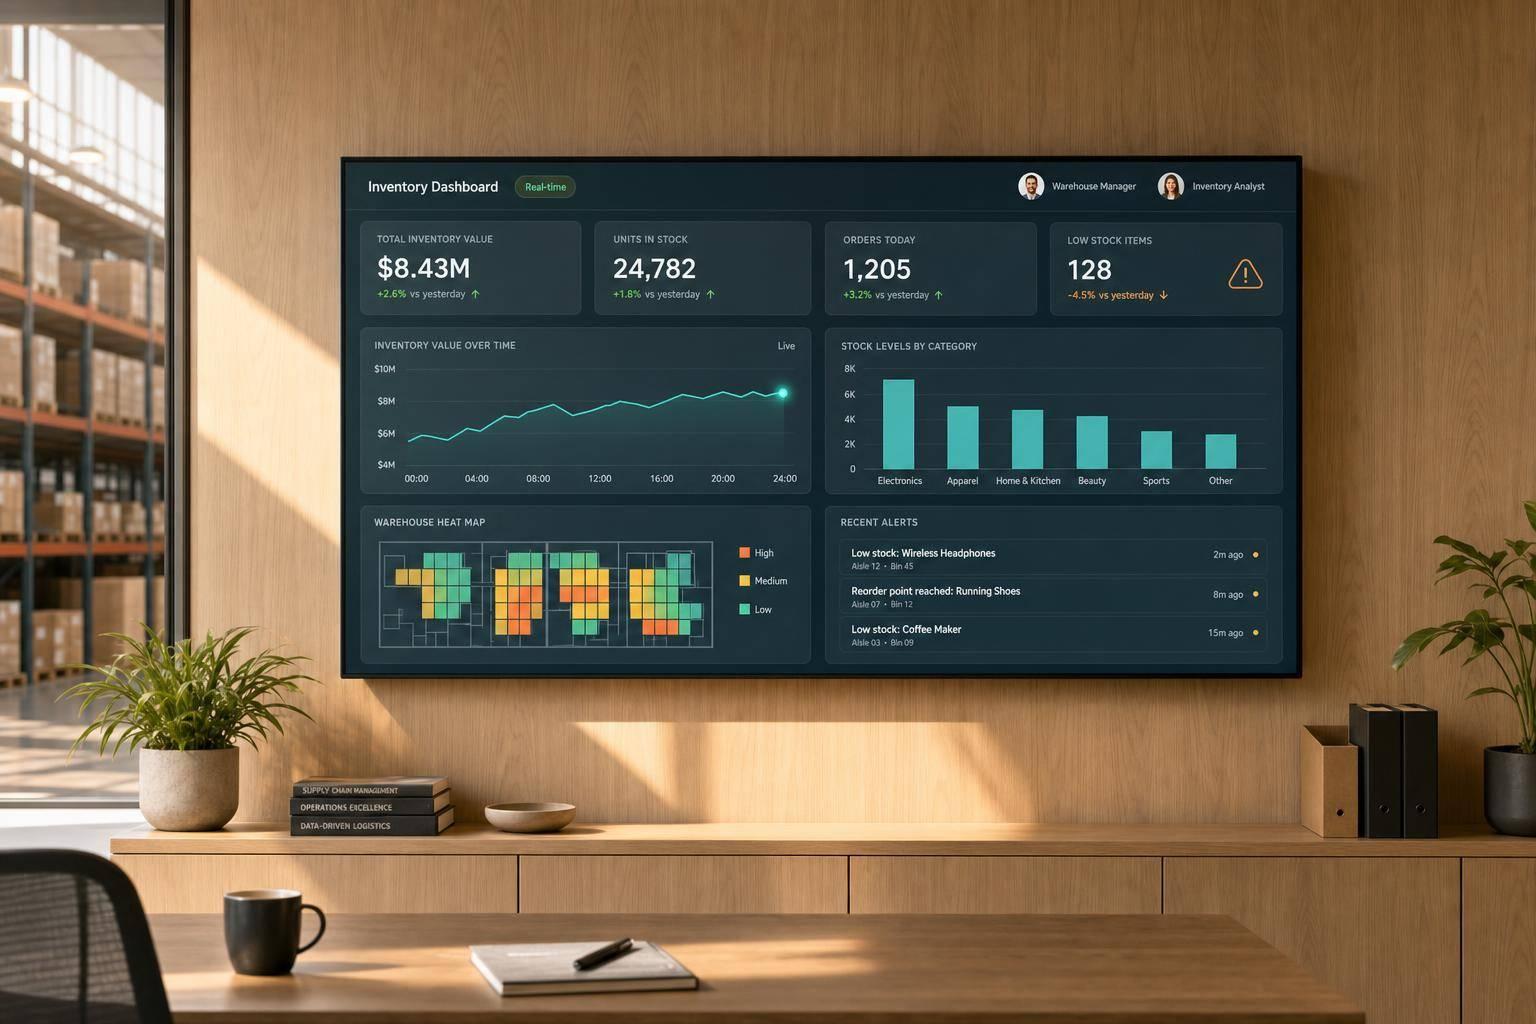
A real-time inventory dashboard helps me see stock, orders, receipts, and count issues in one place - so I can ship with fewer surprises, reorder with less guesswork, and keep QuickBooks Desktop data in line with warehouse activity.
If I were setting one up, I’d focus on a short list first:
- Live stock by SKU and location
- Available quantity, not just on-hand
- Open backorders and late POs
- Inventory value in $
- Cycle count variance and negative stock errors
- Refresh timing by role: about 5–15 minutes for warehouse teams, hourly or daily for executive views
- Role-based views for buyers, warehouse staff, inventory control, and leaders
The core idea is simple: QuickBooks Desktop handles accounting well, but day-to-day stock decisions need more than period-end reports. I need synced transaction data, clean location mapping, a few KPI tiles, drill-down tables, and alerts for low stock, overstock, lot expiry, and count gaps. For example, one bad stock view can tie up $25,000 in extra inventory or hide a SKU that just hit 0 available.
Here’s the short version of what matters most:
- Use transactions like receipts, sales orders, shipments, adjustments, and transfers
- Track on-hand, available, committed, and inventory value
- Add widgets for replenishment, backorders, lot/serial traceability, and cycle counts
- Keep data clean with checks for negative quantities, stale records, and location mismatches
- Limit access by role and location so each person sees the right screen
This guide breaks down the data, KPIs, layout choices, refresh timing, and user views I’d use to build a dashboard people will use every day.
Build the Foundation: Data, Sync, and Core Dashboard Elements
A real-time inventory dashboard only works if the inputs are right. If transaction data is off, location mapping is messy, or sync breaks, the dashboard stops being useful fast.
The first job is simple: figure out which transactions should feed the dashboard the moment they’re posted.
What Data Feeds a Real-Time Dashboard
Every transaction that changes available quantity, commitments, or valuation should flow into the dashboard automatically. That includes purchase orders, vendor receipts, sales orders, invoices, shipments, inventory adjustments, and inter-location transfers.
Each transaction changes a different part of the story. A vendor receipt adds to on-hand stock. A sales order creates a commitment. A shipment lowers available quantity. A transfer moves inventory from one location to another without changing total inventory.
Location matters just as much as quantity. Every transaction should map to the right warehouse or bin so location-level totals stay accurate. Show stock by warehouse or bin, use U.S. dollars ($), and display dates in MM/DD/YYYY format.
| Data Category | What It Captures |
|---|---|
| Sales Activity | Sales orders, order status, partial shipments |
| Purchasing Activity | Purchase orders, PO status, vendor receipts, partial receiving |
| Warehouse Activity | Multi-location tracking, bin movements, transfers |
| Inventory Accuracy | Cycle counts, adjustments, on-hand totals |
| Traceability | Lot numbers, serial numbers, expiration dates |
| Financials | Inventory valuation, reorder points |
Once those feeds are set, you can shape the dashboard around the numbers people need to act on.
Core Widgets Every Inventory Dashboard Needs
A good dashboard should answer three things fast: what needs attention, where the problem is, and which item or location is behind it.
A top-down layout works well here. Put KPI tiles at the top, location panels in the middle, and SKU tables below.
Start with KPI tiles for:
- on-hand stock
- low-stock item count
- open backorders
- total inventory value
Under that, add warehouse and replenishment panels. These should show stock by location and flag items getting close to their reorder point. At the bottom, use SKU-level tables with columns for item, location, available quantity, committed quantity, reorder point, and last movement date.
Those tables should support sorting and filtering. That way, a warehouse manager can zero in on items with low available quantity at a single location without digging around. Trend charts for receipts, shipments, and adjustments also help because they show movement over time, not just a static snapshot.
None of these widgets mean much if QuickBooks Desktop and warehouse activity fall out of sync.
How QuickBooks Desktop Workflows Connect to Dashboard Data

QuickBooks Desktop updates inventory valuation, but it doesn’t show live operational status across locations, open orders, or pending receipts.
That’s where two-way sync comes in. When a receipt is scanned in the warehouse, the dashboard updates as soon as the transaction posts, and that same transaction posts back to QuickBooks Desktop so inventory value stays accurate. When a sales order is entered in QuickBooks, it should flow into the dashboard as committed quantity so the warehouse team can see what’s already reserved.
Without that bidirectional connection, the systems can drift apart. One side says stock is available. The other says it’s spoken for. That gap creates confusion fast.
Rapid Inventory fits this workflow with two-way sync, multi-location tracking, barcode scanning, and lot/serial tracking.
With the data layer set, the next move is picking the KPIs that turn those numbers into day-to-day action.
Choose the Right KPIs for Your Inventory Dashboard
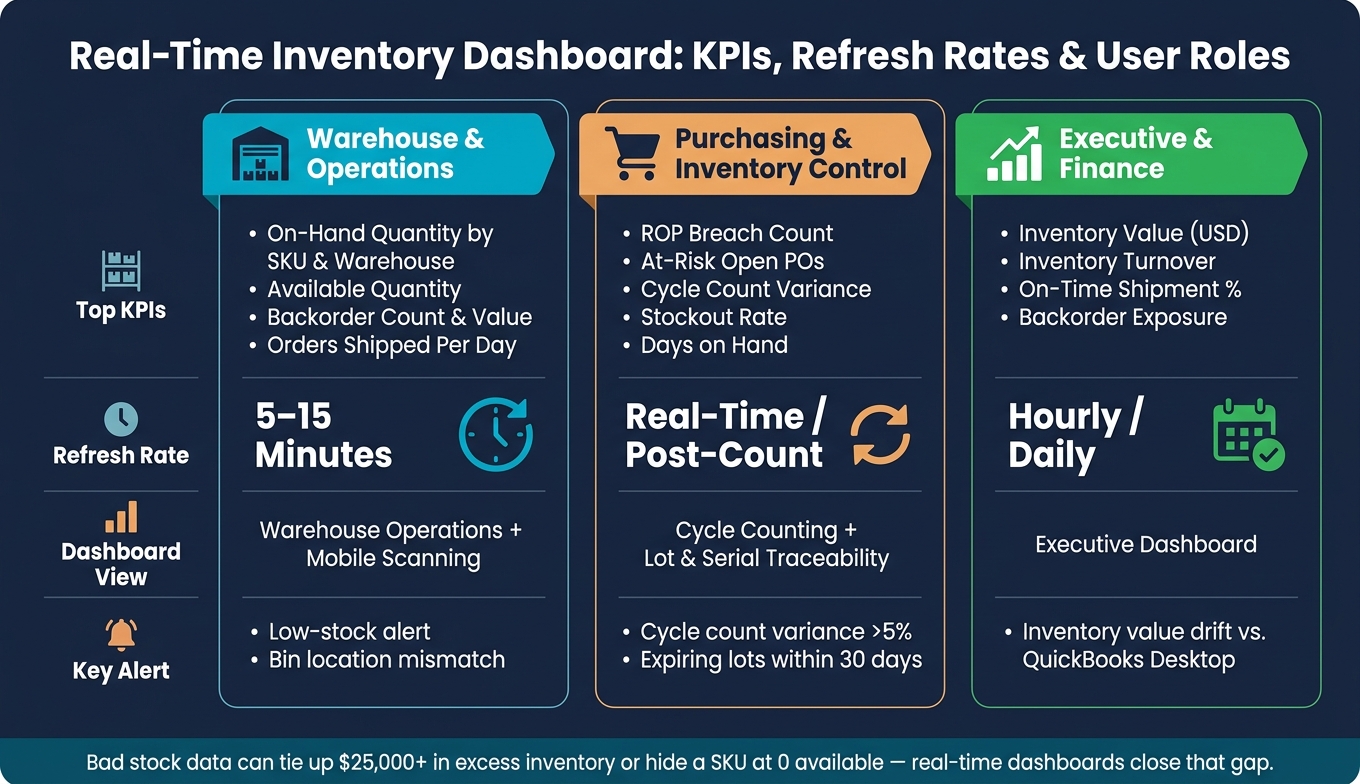
Real-Time Inventory Dashboard: KPIs, Refresh Rates & User Roles
Once your data feed is stable, the next step is simple: pick the metrics that help people act. In QuickBooks Desktop inventory workflows, your KPIs should match posted receipts, committed sales orders, and inventory adjustments. Focus on the numbers that shape day-to-day decisions, then move the lower-level detail into drill-down views.
Stock, Availability, and Valuation Metrics
Start with stock, availability, and value. These are the numbers people check first because they answer the basic questions fast.
- On-hand quantity by SKU and warehouse shows physical stock at each location. Can we fulfill from here?
- Available quantity subtracts committed stock and should guide what you promise customers. Can we promise this order?
- Inventory value in USD ties inventory to financial reporting and should match QuickBooks Desktop's Item Valuation Report.
- Stockout rate points to repeat shortages by showing how often SKUs hit zero available stock during a set period.
- Days on hand shows how long current stock is likely to last. When do we reorder?
- Inventory turnover shows how well stock is moving. What stock is tying up cash?
After stock visibility, shift to replenishment and accuracy.
Replenishment, Accuracy, and Fulfillment Metrics
Replenishment KPIs should sit on the main screen or inside purchasing drill-downs. Show reorder point breaches and at-risk purchase orders on the main screen. Keep supplier, receipt date, and lead-time detail in drill-downs.
For accuracy, show overall cycle count variance or bin accuracy on the main screen. Keep SKU-level and location-level variance in drill-downs, where users can dig in without cluttering the dashboard.
Fulfillment metrics should show how inventory affects service. Track backorders, daily shipments, and on-time shipment percentage. Those numbers make service issues hard to miss. Keep refresh timing in the table below.
These KPIs also help you map the right view to the right user, whether that's warehouse, purchasing, operations, or executive teams.
KPI Comparison Table
| Metric Name | Primary Purpose | How Often to Refresh | Who Uses It |
|---|---|---|---|
| On-Hand Quantity by SKU & Warehouse | Current stock by location | Real-time (per scan) | Warehouse Manager |
| Available Quantity | Promisable stock | Real-time | Operations, Customer Service |
| Inventory Value (USD) | Inventory asset value | Daily / Real-time | CEO, Controller |
| Stockout Rate | Availability gaps | Weekly | Purchasing, Operations |
| Days on Hand | How long current stock lasts | Daily | Purchasing, Operations |
| Inventory Turnover | Stock movement efficiency | Weekly / Monthly | CEO, Purchasing |
| ROP Breach Count | SKUs needing immediate replenishment | Real-time | Purchasing Agent |
| At-Risk Open POs | Overdue or delayed inbound shipments | Daily | Purchasing Agent |
| Cycle Count Variance | Dashboard accuracy after counts | Post-count / Daily | Inventory Control |
| Backorder Count & Value | Unfulfilled demand | Real-time (1–5 min) | Operations, Customer Service |
| Orders Shipped Per Day | Daily fulfillment throughput | Daily / Real-time | Warehouse Supervisor |
| On-Time Shipment % | Service-level performance | Daily / Weekly | Executive, Operations |
sbb-itb-19ed50f
Design and Customize Dashboards for Daily Inventory Work
Use the dashboard layout to put the most urgent action front and center.
Layout, Filters, and Drill-Down Paths
A simple top-middle-bottom layout works well for daily inventory work: summary KPIs at the top, operating panels in the middle, and SKU-level tables at the bottom.
At the top, show the metrics people need first: total inventory value (USD), stockout rate, and open backorders. In the middle, add panels for warehouse performance, replenishment status, and vendor status. That gives supervisors a fast read on which site or supplier needs attention. At the bottom, keep the detailed SKU-level tables with columns for on-hand quantity, available quantity, reorder point, lead time, and lot/serial details.
Use one global filter set across the whole dashboard:
- Date range
- Warehouse/location
- Item category
- Vendor
That way, every widget changes at the same time. For example, you can filter to Last 30 Days, Dallas warehouse, and Finished Goods to check local performance without jumping between screens. Each summary metric should also link to warehouse, SKU, and order-level detail so users can move from the headline number to the root cause in a few clicks.
Custom Widgets for Replenishment, Lot Tracking, and Counting
A low-stock alert widget should list items below reorder point with on-hand quantity, available quantity, and expected receipt date. Buyers can use it to create a purchase order or speed up one that's already open.
An overstock alert widget should flag SKUs where days-on-hand is above a set limit, such as above 90 days. That gives managers a clear signal to run a promotion or trim future order quantities before carrying costs keep climbing.
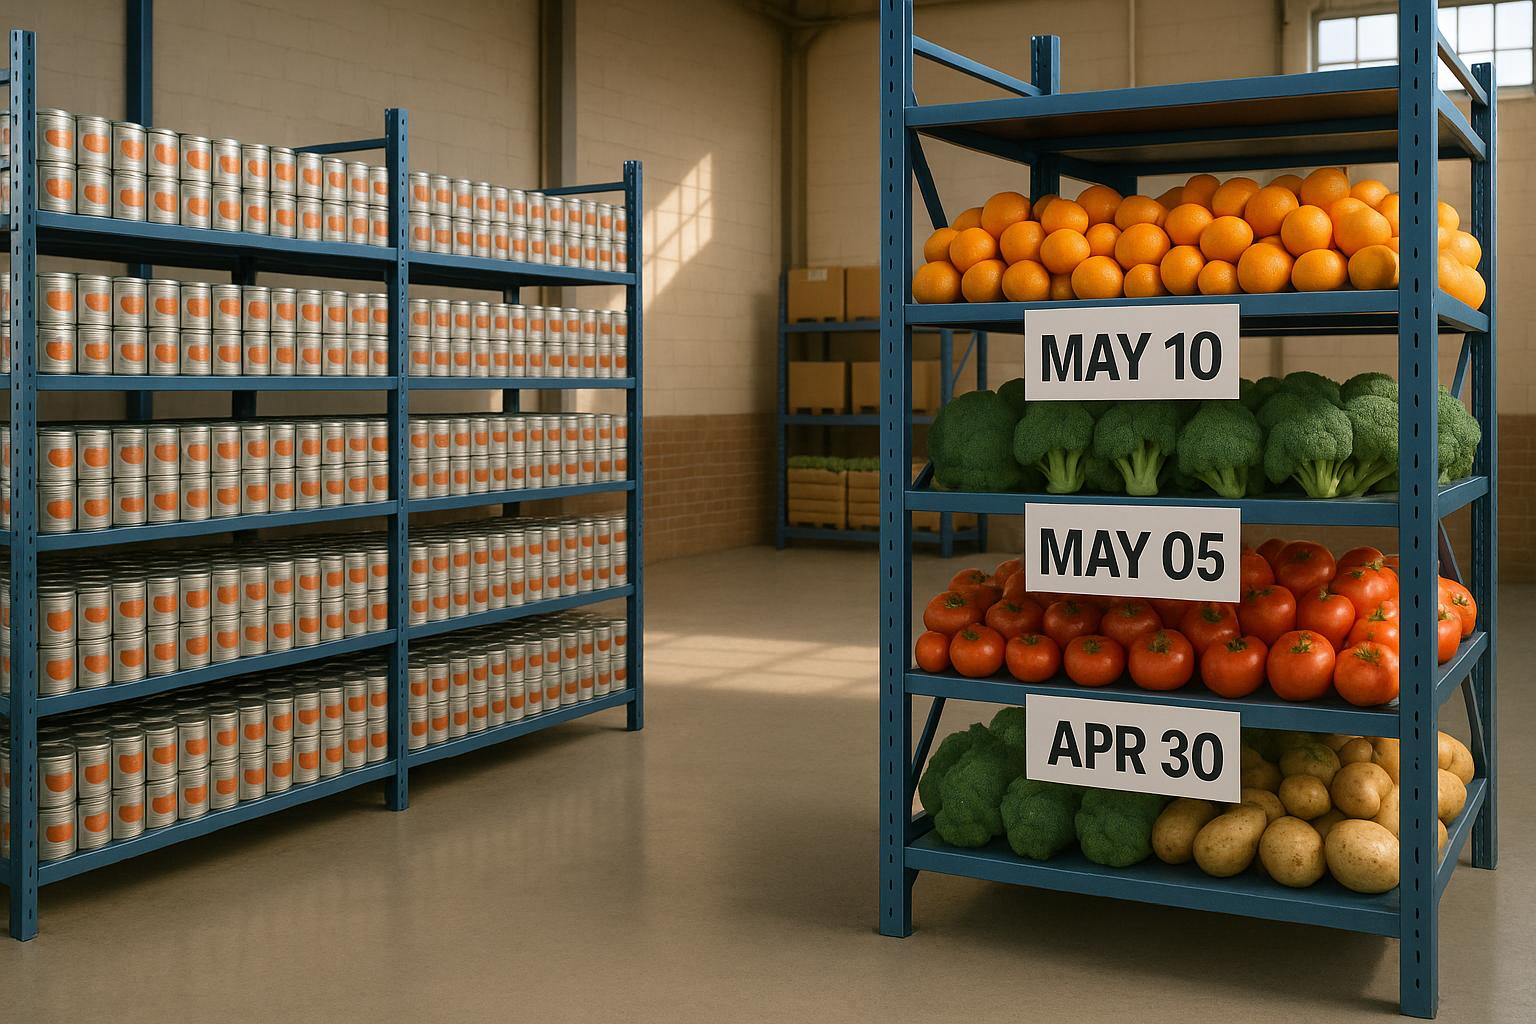
For lot-tracked and perishable inventory, FEFO and FIFO pick widgets matter a lot. These widgets should show all lots for a selected SKU, sorted by expiration date for FEFO or receipt date for FIFO. Include lot ID, warehouse/bin, quantity available, and expiration date. It also helps to color-code lots expiring within 30 days so pickers know what to move first and waste stays lower. Rapid Inventory supports FEFO/FIFO picking strategies alongside lot and serial number tracking, which helps keep these widgets aligned with the pick rules used in the warehouse.
Add a cycle count progress widget to show counts completed vs. planned for the current period. Break it out by area or item class, then add a variance summary table for items where counted quantity differs from system quantity by more than a set threshold, such as more than 5%. Inventory control teams can start with the biggest gaps first. Rapid Inventory's cycle counting workflows can feed completion and variance data into this view, so the dashboard works like a live variance screen.
Use the table below to match each widget to the job it supports.
Widget and Filter Comparison Tables
| Widget Type | Primary Use | Data Source | Typical User |
|---|---|---|---|
| Low-Stock Alert | Trigger replenishment for at-risk items | On-hand, available quantity, reorder points, open POs | Inventory planner, buyer |
| Overstock Alert | Identify excess stock and reduce carrying costs | On-hand, days-on-hand, max stock levels | Operations manager |
| Open Sales Orders vs. Available Quantity | Show demand gaps and promisable quantities | Sales orders, on-hand, incoming POs | Customer service, fulfillment |
| Purchase Order Tracking | Monitor PO status and late inbound shipments | Open POs, receipt history, vendor lead times | Buyer, receiving staff |
| Lot & Serial Visibility | Compliance, quality holds, expiration management | Lot/serial logs, expiration dates, quality holds, location | QA, inventory control |
| FEFO / FIFO Pick View | Enforce correct pick sequence to minimize waste and improve shipment accuracy | Lot expiration dates, receipt dates, bin locations | Warehouse picker, supervisor |
| Cycle Count Progress | Track counting completion and variance by area | Counting workflow, mobile scan activity | Inventory control, warehouse lead |
| Open Backorder Age | Prioritize unfulfilled demand by age and customer | Open sales orders, shipment history | Operations, customer service |
Use filters to narrow the same dashboard for different roles and locations.
| Filter Dimension | Best Use Case | Dashboard Area Where It Applies |
|---|---|---|
| Date Range | Reviewing trends, period-over-period comparisons | Top (summary KPIs and trend charts) |
| Warehouse / Location | Managing stock across multiple sites or bins | Global (all widgets) |
| Item Category | Analyzing specific product lines or stock groups | SKU tables and valuation widgets |
| Vendor | Evaluating procurement lead times and PO status | Middle (replenishment view) |
| Expiration Range | FEFO management for perishable or regulated goods | Lot/serial tracking tables |
| Order Status | Tracking partial shipments, backorders, open orders | PO/SO tracking widgets |
Once the layout is in place, dashboard trust comes down to refresh timing, data quality, and access control.
Operate, Govern, and Improve the Dashboard Over Time
Once the layout is set, the work shifts to upkeep. A dashboard only helps if people trust what they’re seeing. That means keeping it current, accurate, and locked down to the right users.
Refresh Frequency, Data Quality, and Access Control
For warehouse teams, dashboards should refresh every 5–15 minutes. Executive views usually don’t need that pace, so an hourly or daily refresh is often enough.
For most teams, data quality is the bigger problem. If SKU names, units of measure, and location codes aren’t standardized, the dashboard can go sideways fast. It also helps to flag issues early, including:
- Negative on-hand quantities
- Mismatched location totals
- Stale item records
Ownership needs to be clear too. Operations owns location and count accuracy. Purchasing owns item setup. Your ERP admin owns sync integrity. When something breaks, fix it fast before the problem spreads into reports, replenishment, or order planning.
Rapid Inventory's two-way sync and mobile barcode scanning reduce posting errors at the source.
Permissions matter just as much. Executives should see high-level KPIs. Warehouse managers need location stock, replenishment alerts, and task queues. Cycle counters need variance views. Mobile scanning users need a stripped-down screen built around the task in front of them.
Pair those permissions with warehouse or location filters so each person works only within their assigned scope. Review access on a regular basis and remove permissions that no longer fit the role. Those permissions decide which dashboard version each user should see.
Dashboard Types Comparison Table
| Dashboard Type | Primary KPIs | Update Frequency | Key Users |
|---|---|---|---|
| Executive | Inventory value (USD), turns, service level, backorder exposure | Hourly / Daily | Owners, CFOs, Directors |
| Warehouse Operations | Bin location status, pick accuracy, receiving status, replenishment alerts | 5–15 minutes | Warehouse managers, floor supervisors |
| Cycle Counting | Cycle count accuracy, variance rate, unresolved discrepancies | Real-time / Near-real-time | Inventory control, warehouse leads |
| Lot & Serial Traceability | Traceability, expiry monitoring, genealogy tracking | Real-time | QA, compliance, inventory control |
| Mobile Scanning | Next task, item identity, quantity, location | Instant (per transaction) | Pickers, receivers, counters |
Conclusion: Where to Start with a Real-Time Inventory Dashboard
Start narrow. A dashboard built around five high-confidence KPIs - on-hand quantity, low-stock alerts, open backorders, inventory value, and cycle count variance - usually does more for day-to-day work than a giant dashboard nobody fully trusts.
Then add widgets and tighter refresh timing as usage grows.
FAQs
How do I calculate available quantity correctly?
Available quantity is different from quantity on hand.
Quantity on hand is the stock that’s physically sitting in your warehouse or at a given location. Available quantity, on the other hand, accounts for current commitments.
To calculate it, subtract the items already committed to sales orders from your total quantity on hand.
A real-time inventory system helps keep this number accurate as products are sold, received, or transferred.
What should I fix first if the dashboard data looks wrong?
Start by comparing your system records with a physical count. Use your Stock on Hand Report or cycle counting tools to spot gaps such as shrinkage, theft, or data entry mistakes.
Then review barcode scanning and your QuickBooks sync settings to make sure items are matched correctly and that transactions, COGS, and quantities are syncing from active inventory records.
Which KPIs should I launch first?
Start with the KPIs that give you a clear day-to-day view of your inventory and how well your records match what’s actually on the shelf:
- On-Hand Inventory Levels
- Stock Reorder Report
- Cycle Count Accuracy
After that, bring in metrics like Stock Turnover, COGS, and Gross Profit Margin to sharpen your purchasing decisions and pricing.