Analyzing how long inventory stays in your warehouse is key to efficient stock management. QuickBooks Desktop, especially the Enterprise Platinum version (2021+), helps track and categorize inventory by age. Here's how you can use it:
- Enable Inventory Tracking: Activate features like FIFO costing for accurate aging analysis.
- Generate Reports: Use reports like "Inventory Stock Status by Item" to track stock levels and acquisition dates.
- Export Data: Export reports to Excel for detailed analysis and creating aging buckets (e.g., 0–30 days, 31–60 days).
- Calculate Aging: Use formulas to determine how long items have been in stock and identify slow-moving inventory.
- Take Action: Discount or liquidate items older than 90 days to free up cash and storage.
While QuickBooks Desktop lacks a built-in aging report, exporting data and using Excel can bridge the gap. For real-time tracking and advanced features, consider inventory tools like Rapid Inventory. This ensures better accuracy and efficiency in managing stock.

5-Step Stock Aging Analysis Process in QuickBooks Desktop
Setting Up QuickBooks Desktop for Stock Aging Analysis

Turning On Inventory Tracking
To kick off your stock aging analysis in QuickBooks Desktop, you'll first need to configure the inventory tracking feature. Here's how: head to the Edit menu, select Preferences, then click on Items & Inventory and open the Company Preferences tab. From there, check the box labeled Inventory and Purchase Orders are Active. This enables tracking for inventory levels, costs, and reorder points.
For QuickBooks Desktop Enterprise users, there's an extra step. Click on Advanced Inventory Settings to activate FIFO (First-In, First-Out) costing. This ensures the oldest inventory is sold first, which is crucial for accurate aging analysis. Advanced Inventory also gives you access to tools like multi-location tracking, bin/lot management, and serial number tracking. If you find the Advanced Inventory Settings button grayed out, you’ll need to sync your license data. Just go to Help > Manage My License > Sync License Data Online.
Once that’s done, double-check that your item details and purchase dates are correctly entered. This step is essential for generating accurate aging reports.
Checking Item Setup and Purchase Dates
With inventory tracking switched on, the next step is making sure each item is set up correctly. When adding products to your Item List, assign a unique SKU, include a description, and link the item to the right inventory account. During setup, make sure to input the Initial Quantity on Hand and its As of Date - this date marks the starting point for tracking that specific quantity.
When entering purchase transactions, always use dates that come before the related sales transactions. This is because QuickBooks uses purchase orders and sales receipts to calculate when inventory was received. Incorrect dates can lead to negative inventory balances, which can throw off your aging reports. Additionally, set reorder points for each item during setup so QuickBooks can alert you when stock levels hit a critical threshold.
To keep your inventory data accurate, consider performing regular cycle counts. These checks can improve inventory accuracy to about 97%, ensuring your aging analysis remains reliable.
sbb-itb-19ed50f
Finding and Customizing Inventory Reports
Opening Inventory Reports
QuickBooks Desktop doesn't have a specific "Inventory Aging" report, though you can use inventory management software for QuickBooks Desktop to automate this process like it does for Accounts Receivable or Accounts Payable. However, you can use existing inventory reports and tweak them to analyze stock age. To get started, go to the Reports menu, select Inventory, and choose one of these options:
- Inventory Valuation Summary/Detail: Shows the total value and quantity of items on hand as of a certain date.
- Inventory Stock Status by Item: Lists current stock levels, items on order, and upcoming delivery dates.
- FIFO Cost Lot History by Item: Available for QuickBooks Enterprise users with Advanced Inventory. This report tracks acquisition dates and costs for specific lots, helping you determine how long stock has been held.
While these reports provide useful data, they don't automatically categorize items by age (e.g., 0–90 days, 91–180 days) [2, 19]. To create those age buckets, you'll need to export the data to Excel and set up custom categories there.
Adjusting Report Settings
Use the Customize Report option to tailor the data to your needs. Once inside Customize Report, you can:
- Set the Date range to All or a specific time frame.
- Apply Filters to focus on specific Items, Inventory Sites, or Inventory Asset accounts.
- Change Display Columns by to Month and set the Detail Level to All except summary [17, 20].
This setup helps you track inventory trends over time. However, keep in mind that adding columns like Purchase Date or Date Received might result in blank fields in summary reports. These details are often aggregated from multiple transactions.
For users who don’t have QuickBooks Enterprise, you can include the receipt date in lot numbers (e.g., "Lot12345-030626") to easily view batch age directly on the report.
Once your report is customized, export the data to Excel for further analysis.
Exporting Data for Further Analysis
Exporting Reports to Excel
Once you’ve customized your report in QuickBooks Desktop, exporting the data to Excel is a straightforward process. This allows you to refine and analyze your inventory data further. To start, click the Excel button on the report toolbar. From there, you’ll have two options: Create New Worksheet, which generates a new Excel file, or Update Existing Worksheet, which refreshes data in an already existing file.
Before finalizing the export, click Advanced in the export dialog box and uncheck the Space between columns option. This ensures your data is exported as a clean, flat table, making it easier to work with when applying formulas or creating pivot tables. If you encounter blank purchase dates, you can export your inventory list as an IIF file by navigating to File > Utilities > Export > Lists to IIF Files. For QuickBooks Desktop Enterprise users with Advanced Inventory, the FIFO Cost Lot History report can also serve as a detailed data source.
"Exporting reports from QuickBooks Desktop to Excel can be a game-changer for your business. It allows you to leverage the powerful data analysis and reporting capabilities of Excel while still managing your financials in QuickBooks."
- Ashley Taylor, Product Manager, Cleverence
Once your data is clean and ready, you can move on to setting up aging buckets to analyze your inventory.
Setting Up Aging Buckets and Calculating Metrics
After exporting your data to Excel, make sure the Purchase Date column is formatted as a date. This step is crucial for formulas to calculate accurately. Next, create a new column called Days Aging and use the formula =TODAY() - [Purchase Date Cell] to calculate how many days each item has been in your inventory. The TODAY() function automatically updates, ensuring your analysis reflects the current date.
Add another column for Days x Quantity with the formula =[Days Aging] * [Quantity]. This calculation highlights older inventory that takes up significant space or ties up capital. To categorize items into aging buckets, set up a reference table with ranges (e.g., 0 = "0-90 Days", 91 = "91-180 Days", etc.). Then, use a formula like =VLOOKUP([Days Aging], [AgingTableRange], 2, TRUE) to assign each item to a bucket. Adjusting bucket ranges becomes simple with this method.
For users who exported data as an IIF file, you may need to convert timestamps in specific columns (e.g., column D) into readable dates. Use the formula =(D37/86400)+25569 to make the conversion.
Creating Pivot Tables for Stock Analysis
To streamline your analysis, convert your data into an Excel Table by pressing Ctrl+T. This ensures any updates or additions to your data are automatically reflected in your pivot table. Afterward, insert a pivot table and organize your data by dragging Item to the Rows area, Aging Buckets to the Columns area, and Sum of Acquisition Amount to the Values area. You can also include the Quantity field to view both the financial and physical impact of aging inventory.
Switch the pivot table to Outline Form and turn off Grand Totals for rows to simplify the view. If needed, manually adjust the order of aging buckets for clarity. Whenever you update your QuickBooks export or modify bucket definitions, just right-click the pivot table and select Refresh to load the latest data.
For a more streamlined approach to inventory management, consider using Rapid Inventory. Their tools integrate seamlessly with QuickBooks Desktop, offering features like real-time inventory tracking and automated workflows to simplify stock analysis. Learn more at https://rapidinventory.com.
Understanding Your Stock Aging Results
Identifying Inventory Trends from Your Data
Once you've exported your data and set up a pivot table, it's time to dig into your aging analysis. Start by examining how your inventory is distributed across the aging buckets. Ideally, the bulk of your stock should fall within the 0–90 day range. This indicates you're turning inventory quickly, which is great for maintaining cash flow. However, if you notice a growing percentage in the 61–90 day or 90+ day buckets, it could be a warning sign of slow sales or excess inventory.
Inventory sitting in the 60+ day range ties up your capital. While discounting below cost can hurt your margins, it might free up much-needed cash and warehouse space. For items that have been stagnant for six months or more, they’re likely "dead wood." These products are unlikely to sell at full price and should either be liquidated or written off to cut down on ongoing storage and insurance costs.
"Ideally, you want to have most of your stock in the first two buckets or below six months. This means you have more fresh stock than aged stock and most of your stock sells at full price or higher margins."
To pinpoint slow-moving items, compare your Inventory Valuation Detail report with a Sales Report for the same timeframe. Products that show up on the valuation report but not on the sales report are prime candidates for discounting or liquidation. Use the Days x Quantity metric you calculated earlier to determine which aging items are draining your resources the most.
Once you've analyzed your inventory trends, it’s important to consider the limitations of your tools, such as QuickBooks Desktop, to understand how they might affect your analysis.
Understanding QuickBooks Desktop Limitations
While QuickBooks Desktop offers basic inventory tracking, it has several shortcomings when it comes to providing real-time insights. For example, QuickBooks Desktop doesn't have a built-in inventory aging report. Even the more advanced QuickBooks Enterprise Platinum (2021 and later) only provides summary and detail reports, which may not update in real time. Additionally, its default average costing method can obscure specific purchase dates, making it harder to track when individual units were bought - unless you switch to FIFO in the Enterprise version.
"QBDT reporting has always been that frustrating, they allow you to select fields as column headers but will not display info... The report is a summary report, total qty on hand now - purchase dates are details."
- Rustler, QuickBooks Elite ProAdvisor
For businesses managing multiple warehouses or selling across various channels, relying on manual Excel workarounds can lead to delays and inaccuracies. If there’s a 2–5 day lag between sales and updates in QuickBooks, your aging reports might still show inventory that’s already been sold.
This is where tools like Rapid Inventory can make a difference. It offers real-time inventory reporting, automatic two-way syncing with QuickBooks Desktop, and built-in FIFO/FEFO strategies for managing aging without the need for manual exports. With features like multi-location tracking and mobile barcode scanning, you can ensure your aging data stays accurate across all warehouses. Explore more at https://rapidinventory.com.
Conclusion
To carry out stock aging analysis in QuickBooks Desktop, you’ll need to follow a few steps. Start by enabling inventory tracking in your preferences and activating FIFO costing if you're using the Enterprise version. Then, generate detailed reports like the "Inventory Stock Status by Item" and export the data to Excel. From there, you can create aging buckets using pivot tables. While this method gives insight into which items are tying up capital, it does require manual effort since QuickBooks Desktop doesn’t include a built-in aging report.
Effective inventory tracking is crucial for identifying slow-moving stock, cutting down on carrying costs, and improving cash flow. Items that linger in inventory come with added expenses for storage, insurance, and handling, which can drain resources over time. These challenges point to the need for a more efficient solution.
That’s where Rapid Inventory steps in. It offers real-time two-way syncing with QuickBooks, mobile barcode scanning for near-perfect accuracy, and built-in FIFO/FEFO tracking across multiple locations. Pricing starts at $90 per user/month for the Pro plan or $900 per month for unlimited users. The platform also includes white-glove onboarding and has earned five-star reviews from over 400 customers. Business owner Nicholas G shared his experience:
"Rapid Inventory with Quickbooks Desktop is exactly what we need to run our company. ... Simple and straightforward, very easy to learn and easy to work with".
FAQs
What is the best QuickBooks Desktop report for inventory aging?
The Inventory Aging Report in QuickBooks Desktop Enterprise is a powerful tool for analyzing how long your inventory has been sitting in stock. It offers detailed insights into the age of your inventory, helping you manage stock levels efficiently and make smarter business decisions.
How do I handle missing purchase dates in exports?
Handling missing purchase dates in QuickBooks exports can be a bit of a hassle, but it's manageable with the right approach. First, make sure purchase date fields are properly filled during data entry or when importing information. Missing dates often stem from incomplete entries or glitches during the export process.
If you notice missing dates, you might need to manually update them directly in QuickBooks. Alternatively, take a closer look at your import process to ensure purchase dates are being included as part of the data transfer. Tools like Rapid Inventory can also be a game-changer, as they help maintain data accuracy and ensure better synchronization between systems.
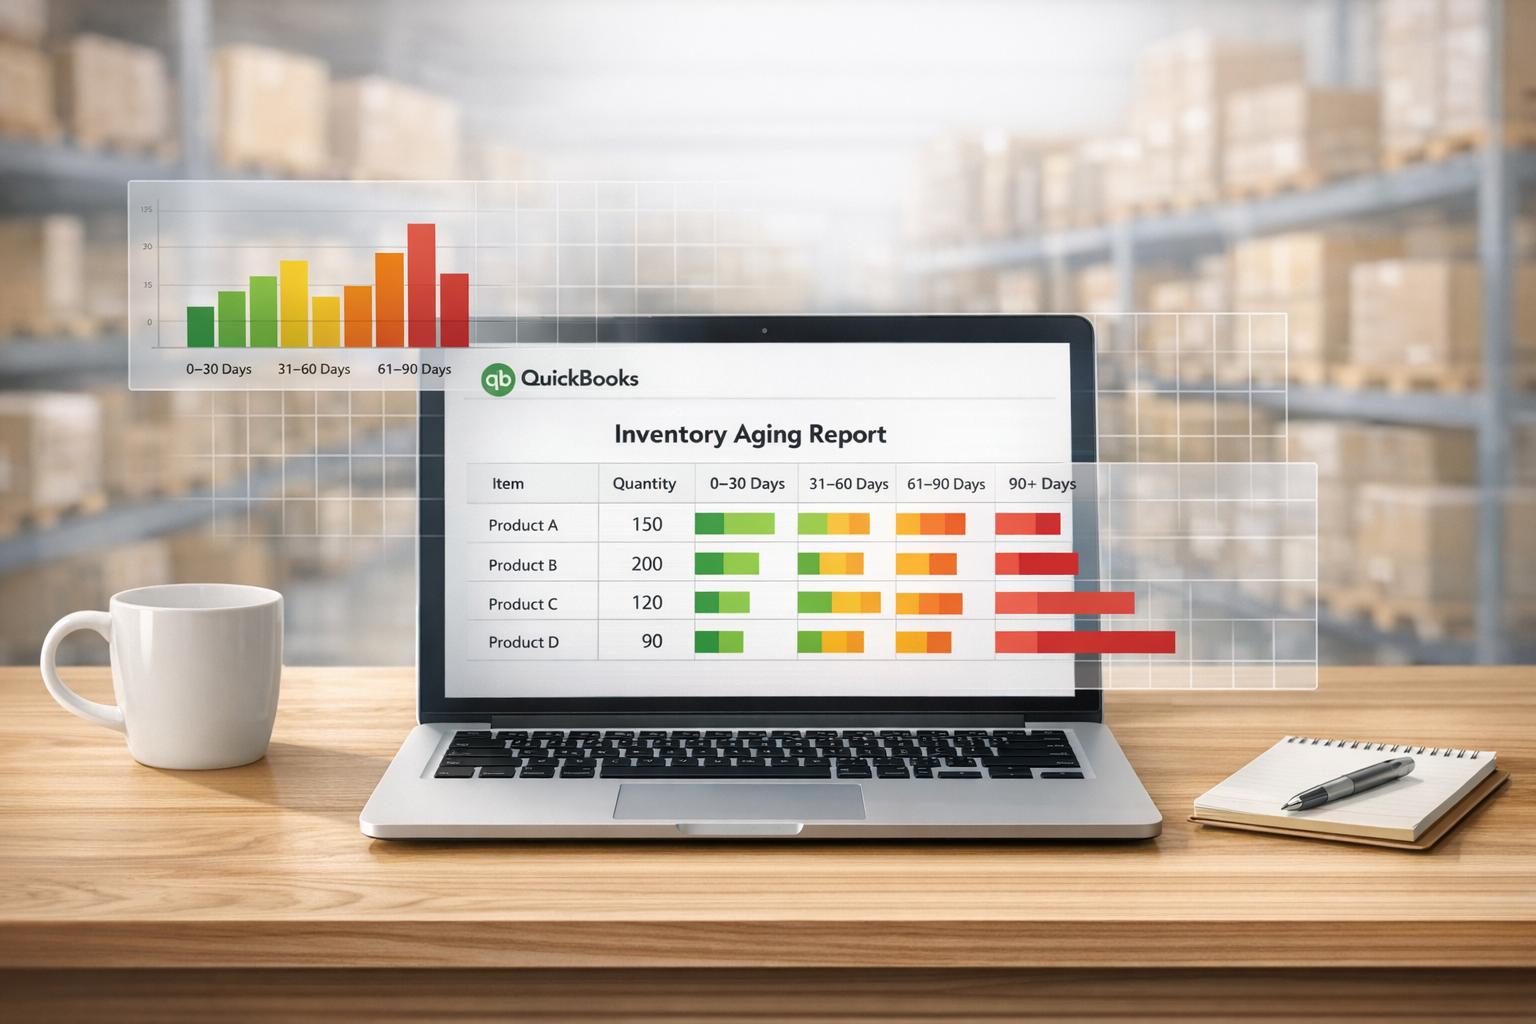
What aging buckets should I use for my inventory?
The suggested aging buckets for inventory analysis are: 0–30 days, 31–60 days, 61–90 days, and over 90 days. These groupings make it easier to spot slow-moving inventory and monitor how long products have been sitting in stock. If you're using QuickBooks Desktop, you can adjust these buckets in your reports to align with your specific business requirements.