If I want to know whether zone picking is working, I don’t look at one number. I track six: pick time, order accuracy, travel, congestion, backorders, and stock variance.
That gives me a plain view of what’s helping output and what’s hurting it. For example, a zone can pick fast but still cause errors. Or travel can look low while congestion slows the aisle. And if backorders move above 1.0% or inventory accuracy drops under 99.8%, I know I need to check counts and shelf stock right away.
Here’s the short version:
- Pick time shows whether each zone is keeping pace
- Order accuracy shows whether speed is causing mistakes
- Travel time and distance show how much labor is spent walking
- Zone congestion shows aisle crowding and flow problems
- Backorder rate shows whether demand is being met on time
- Stock variance shows whether system counts match physical stock
I’d review these on different schedules instead of treating them all the same:
- Real-time: zone congestion
- Daily: pick time, order accuracy, backorders
- Weekly: travel time and distance
- Monthly or after counts: stock variance
A simple dashboard works best when I read the numbers by zone, not only across the full warehouse. That makes it easier to spot whether the problem is labor, layout, replenishment, or inventory records.
The rest of the article explains what each metric says and how to use the numbers to fix the cause, not just the symptom.
Dynamic Zone Picking for Order Fulfillment - What is it?
sbb-itb-19ed50f
Why These 6 Metrics Matter for Zone Picking
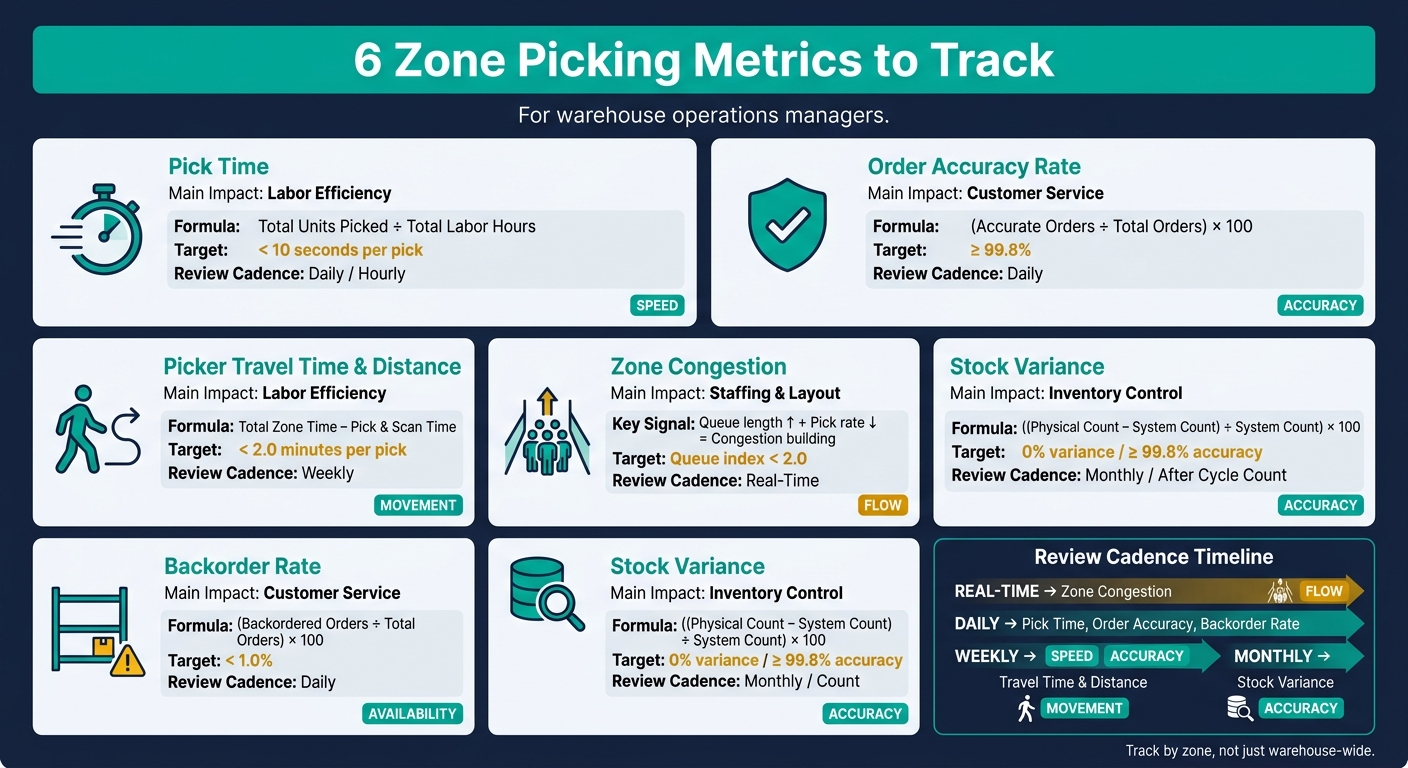
6 Zone Picking Metrics: Targets, Cadence & Impact at a Glance
One KPI on its own won't tell you much. In zone picking, you need to watch several KPIs at the same time because one number can hide the real problem.
These six metrics show you what's happening across speed, accuracy, movement, congestion, inventory availability, and stock control. Pick time and travel distance point to labor efficiency. Order accuracy and backorder rate affect customer service. Zone congestion can hint at staffing gaps or a layout problem. Stock variance shows whether your system count lines up with what's actually on the shelf.
That matters because order errors don't stop at the pick line. They lead to returns, replacements, complaints, and extra picking cost.
Use these six KPIs to spot the bottleneck before you change layout, staffing, or inventory controls. Here's what each one tells you and how to think about the result.
| Metric | Main Impact | Result |
|---|---|---|
| Pick Time | Labor Efficiency | Faster fulfillment; lower labor cost per order |
| Order Accuracy Rate | Customer Service | Fewer returns, replacements, and complaints |
| Picker Travel Time & Distance | Labor Efficiency | Reduced cost per order; less operator fatigue |
| Zone Congestion | Staffing & Layout | Identifies bottlenecks during peak periods |
| Backorder Rate | Customer Service | Measures how reliably demand is being met |
| Stock Variance | Inventory Control | Ensures data matches physical stock for reliable decisions |
Next, break each metric down so you can see what a good or bad result looks like.
1. Pick Time
Start with pick time. It tells you if each zone is moving at the pace it should.
Pick time shows how fast pickers finish work in a zone. Track it as pick rate:
Pick Rate (Zone) = Total Units Picked in Zone ÷ Total Labor Hours in Zone
Use start and completion scans to measure each pick. That gives you a clean way to compare zones, shifts, and staffing levels without guessing.
Pull this data from WMS scan records. Review pick time daily, or in real time if you can, so slow zones show up before they hold up shipping.
Set a baseline, then flag any zone that drops below it. From there, look for common trouble spots like:
- Bottlenecks
- Idle time
- Staffing imbalance
Once you know the speed, the next step is simple: check whether fast picking is still leading to correct orders.
2. Order Accuracy Rate
Once you know whether each zone is picking at the right pace, the next step is simple: make sure that speed isn't causing mistakes. Fast picking only helps if the order is still correct. Order accuracy rate shows the share of orders picked without item or quantity errors.
The formula is straightforward:
Order Accuracy Rate (Zone) = (Accurate Orders from Zone ÷ Total Orders from Zone) × 100
You can pull this from your WMS order fulfillment reports. Because zone picking keeps each picker in a set area, your WMS can usually trace errors back to a specific zone. That makes it much easier to see what's going wrong. Maybe one section has labeling problems. Maybe the lighting is poor. Maybe congestion is slowing people down and leading to bad picks. You're not dealing with a warehouse-wide issue every time.
Review this metric daily. Use the manual error range as your action threshold. If a zone goes above it, dig in right away.
Don't stop with internal data, either. Post-shipment returns and customer complaints can expose mistakes that slipped past internal checks. That extra layer helps confirm which zone is behind the problem. Rapid Inventory supports mobile barcode scanning and real-time inventory reports, which can help your team verify issues faster.
If accuracy looks fine but orders are still moving too slowly, check travel time and distance next.
3. Picker Travel Time and Distance
If pick time looks fine but throughput still drags, travel time can show where the zone is losing time.
Picker travel time and distance measures how much time and walking a picker spends moving inside a zone. It helps you separate movement time from the time spent doing the actual pick.
To measure it, subtract pick and scan time from the total time spent in the zone. Your WMS should show this in zone-level traffic or efficiency reports. If those reports keep showing overlap in the same aisles or pick faces during peak demand, it’s time to look at the zone layout. High travel distance can also point to picker fatigue.
Review this every day.
If travel time stays low but throughput still lags, zone congestion is the next metric to check.
4. Zone Congestion
Zone congestion happens when multiple pickers crowd into the same aisle or pick location. The result is simple: throughput slows across the zone.
To spot it, look at queue length, pick rate, and zone throughput together. If queue length goes up while pick rate goes down, congestion is building.
Pull this data from your WMS, labor management system, and automation tools like pick-to-light. A live dashboard helps a lot here. It lets rising queues and falling throughput show up before shipping starts to slip.
This is something to review in real time, not once a day. Unlike pick time or travel distance, congestion can build fast and disappear just as fast, sometimes within an hour. If you wait until the end of a shift, the slowdown has already hit output.
When the live view shows a queue growing, act right away. Move a picker from an idle zone into the congested one. If the same zone backs up at the same time every day, that usually points to order prioritization or workflow timing as the cause.
5. Backorder Rate
After congestion, the next thing to check is whether those slowdowns are turning into orders you can't fill on time.
Backorder rate measures the percentage of customer orders that can't be fulfilled at the scheduled time because of stockouts, inventory errors, or supply chain problems. In a zone picking setup, this metric helps you see which zones are falling short on demand.
The formula is (Number of Backordered Orders ÷ Total Number of Orders) × 100 = Backorder Rate.
For each zone, calculate the rate using orders that include SKUs assigned to that zone. Then review the numbers by shift or by week. That's often where patterns start to show up.
You can pull this data from your WMS, ERP, or inventory management platform. If you use QuickBooks Desktop, Rapid Inventory adds backorder tracking and real-time inventory reports.
Backorder rate tells you how closely demand, replenishment, and inventory records match up. Check it daily or in real time. If a zone moves above your benchmark - ideally below 1% - run a cycle count.
If the rate stays high, check stock variance next.
6. Stock Variance
When backorders stay high, stock variance helps you figure out where the issue starts. Is the item missing from the shelf, or is the system count just wrong?
Stock variance is the gap between system count and physical count in a zone. Looking at variance by zone makes it easier to spot where picking, replenishment, or sync errors begin.
Use this formula: ((Physical Count − System Count) ÷ System Count) × 100 = Stock Variance %. Check the physical count against the system count for each zone, not just the warehouse as a whole. One blended warehouse number can gloss over the spots that need work.
You can pull this data from your WMS, inventory management software, or real-time dashboards. Review zone variance daily or right after each cycle count.
The target is 99.8% inventory accuracy. If any zone falls below that mark, run a cycle count and dig into the root cause. In most cases, variance points back to picking, replenishment, or sync errors. If you catch it early, you can stop a small mismatch from snowballing into a stockout or an emergency reorder.
Track the number first. Then trace the cause before you change layout or staffing.
How to Review These Metrics Without Missing the Root Cause
Zone picking gets better when you track the right numbers on the right schedule. That’s the part many teams miss.
Live visibility helps you shift labor before a small delay turns into a bigger mess across the floor.
Here’s a simple way to group these metrics by review cadence:
| Frequency | Metrics to Review | Why |
|---|---|---|
| Daily | Pick time, order accuracy, zone congestion | Catch bottlenecks early and rebalance labor |
| Weekly | Travel time and distance, backorder rate | Spot recurring patterns and supply or workflow issues |
| Monthly / Quarterly | Stock variance | Validate inventory accuracy and identify count discrepancies |
A good rule of thumb: review picker travel weekly. Review backorders daily for exceptions, then weekly for trends. That split helps you decide what belongs on a live dashboard versus what fits better in a weekly or monthly report.
It also helps to read metrics in pairs, not on their own. Look at speed alongside accuracy. Look at backorders alongside stock variance. If one number shifts, don’t stop there. Compare it by zone, shift, day, SKU family, and picker.
Start with the zone first. If one zone looks off, you’re likely dealing with a zone-level issue. If the same pattern shows up across several zones, the problem is probably tied to a broader process or training gap.
Once the cadence is in place, bring these metrics into one dashboard view so slow zones stand out fast.
A Simple Zone Performance Dashboard Layout
After you lock in your daily, weekly, and real-time review cadence, bring all six metrics into one live dashboard. The idea is simple: put everything in one place so you can spot the outlier zone fast instead of bouncing between separate reports.
That dashboard should show each metric's current result, target, trend, and review frequency. For most warehouse supervisors, that gives a clear at-a-glance view of what's off, what's on track, and what needs attention now.
Here’s a layout that works well for most warehouse supervisors:
| Metric | Current Result by Zone | Target | Trend | Review Frequency |
|---|---|---|---|---|
| Pick Time | - | <10s | Down | Hourly |
| Order Accuracy Rate | - | 99.8% | Up | Daily |
| Picker Travel Time | - | <2.0 minutes per pick | Down | Weekly |
| Zone Congestion | - | <2.0 | Down | Real-time |
| Backorder Rate | - | <1.0% | Flat | Daily |
| Stock Variance | - | 0% | Down | Monthly |
Once the dashboard is live, review the numbers by zone, not just at the warehouse-wide level. That’s where problems usually show up first.
Rapid Inventory can populate backorder rate and stock variance from real-time inventory data.
Conclusion
When you put these six metrics on one dashboard, the picture gets a lot clearer. You can see if the issue is speed, travel, congestion, or inventory. More than that, you can tell if zone picking is getting better in the areas that matter most: speed, accuracy, movement, congestion, availability, and inventory control.
Regular review is what turns raw numbers into action. If zone congestion spikes, that can point to a layout or workflow problem. If the backorder rate starts climbing, you may be looking at a replenishment gap or an inventory record problem before customers feel the impact. And if stock variance keeps growing, that's a warning sign your records need work before it turns into a stockout or a missed order.
The aim is simple: catch problems before they reach the customer. With steady tracking and a clear dashboard, your team can spend less time reacting to complaints and more time fixing the root cause.
Track all six metrics together, and zone picking gets much easier to diagnose, adjust, and grow. Use the trends to fix the zone, not just the symptom.
FAQs
Which metric should I fix first?
Start with a thorough physical inventory count so you have a clean, accurate baseline. From there, zero in on three or four KPIs that map to your biggest day-to-day problems.
If product availability and inventory flow are causing headaches, keep a close eye on inventory turnover, days' sales of inventory, and stockout rates. Those numbers show whether goods are moving as they should or sitting too long.
If the bigger issue is fulfillment quality and speed, use real-time data to spot weak points in the process. Put order accuracy first. Speed metrics like pick rates matter, but they come after you know orders are being filled correctly.
What causes low zone picking accuracy?
Low zone picking accuracy usually comes down to a few familiar problems: old inventory data, a poor warehouse layout, inconsistent labels, and manual work like paper tickets, memory, or hand-entered data.
Other common causes include:
- overcrowded aisles
- unclear location codes
- goods stored in the wrong way
- limited training
- worker fatigue
- incentives that push speed over accuracy
When these issues pile up, mistakes stop looking random. They start to look like the system is setting people up to miss picks.
How often should I review each KPI?
Review your primary KPIs every week, with extra attention on the three or four linked to your most urgent warehouse issues.
For cycle counts, check fast-moving or high-value items weekly. Lower-priority items can be reviewed monthly or quarterly. Reorder points and similar inventory settings should be checked every 30 to 60 days, or sooner if sales velocity, seasonality, or supplier lead times shift. Real-time dashboards can help you spot problems as they happen.