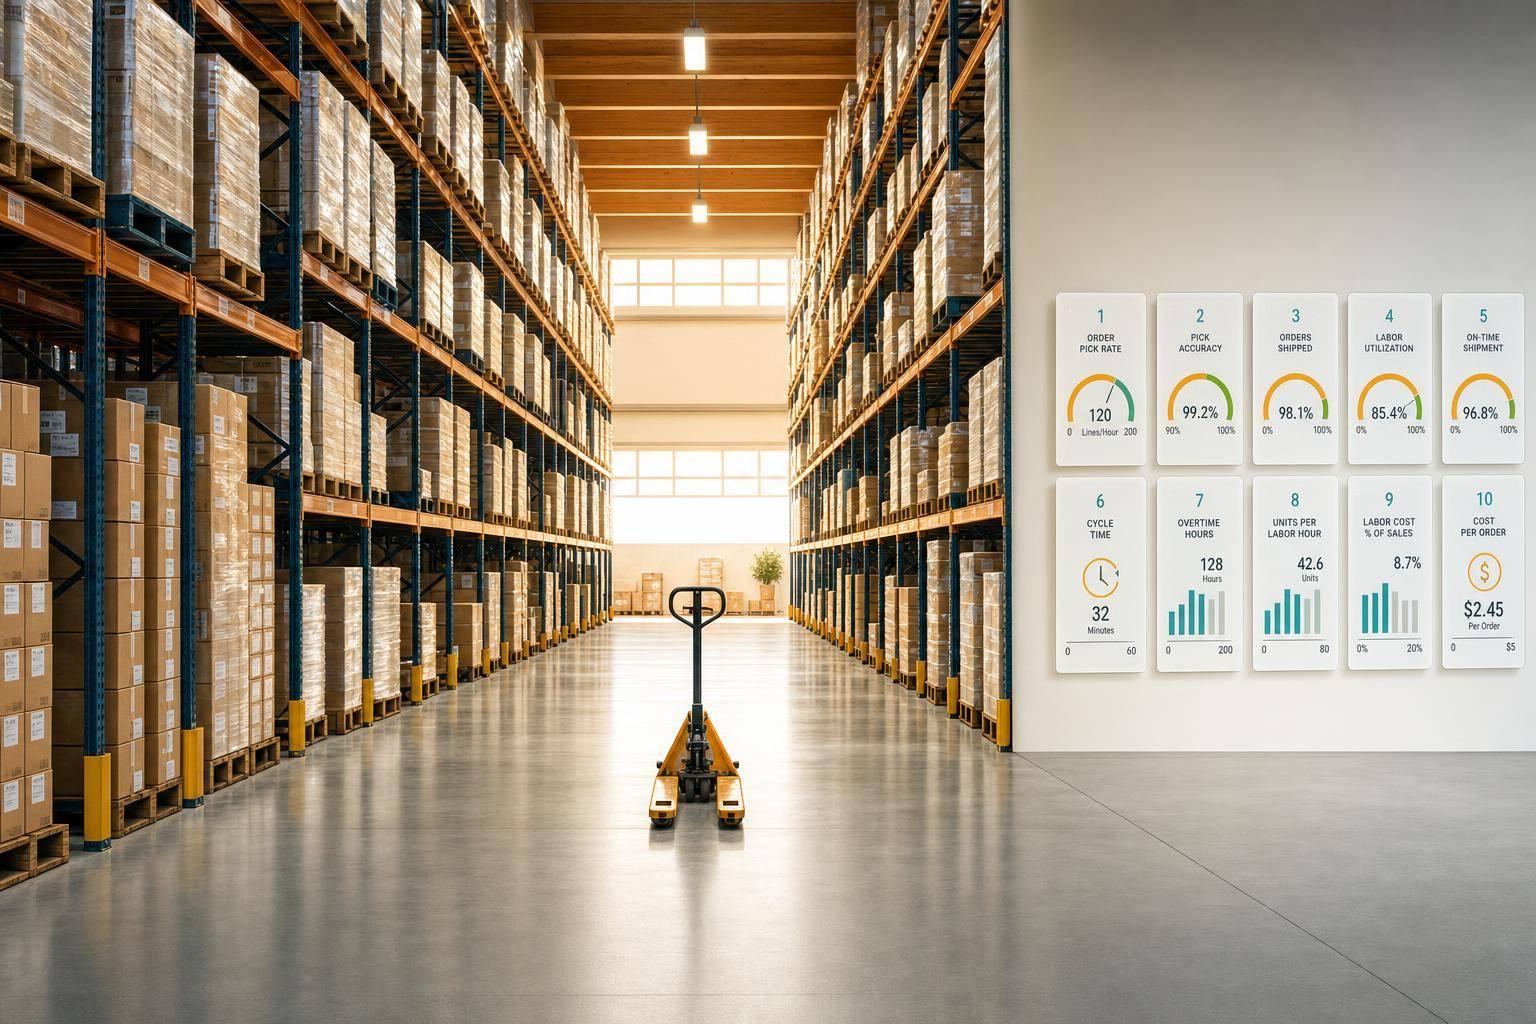
If I want tighter labor cost control in a warehouse, I track 10 numbers: speed, output, overtime, idle time, errors, labor cost, labor share of revenue, utilization, and rework. That gives me a plain view of where hours are going, where money is leaking, and whether I need more people or a better process.
Here’s the short version:
- Speed: picks per hour, lines per labor hour, orders per labor hour
- Time loss: overtime share, idle time percentage, labor utilization rate
- Accuracy: picking error rate, rework and returns from labor errors
- Cost: labor cost per order, labor cost as a % of fulfillment revenue
If I use QuickBooks Desktop, I can get payroll, sales, invoices, and return data there. But warehouse KPIs also need floor data like scans, picks, counts, and task time. That’s the gap this article explains how to close.
What I’d watch first:
- If picks per hour drops, I’d check slotting, walking time, and training.
- If overtime climbs week after week, I’d review shift plans before payroll jumps.
- If error rate goes up, I’d expect more rework, returns, and manual fixes.
- If labor cost per order rises while order volume stays flat, I’d look for waste before adding headcount.
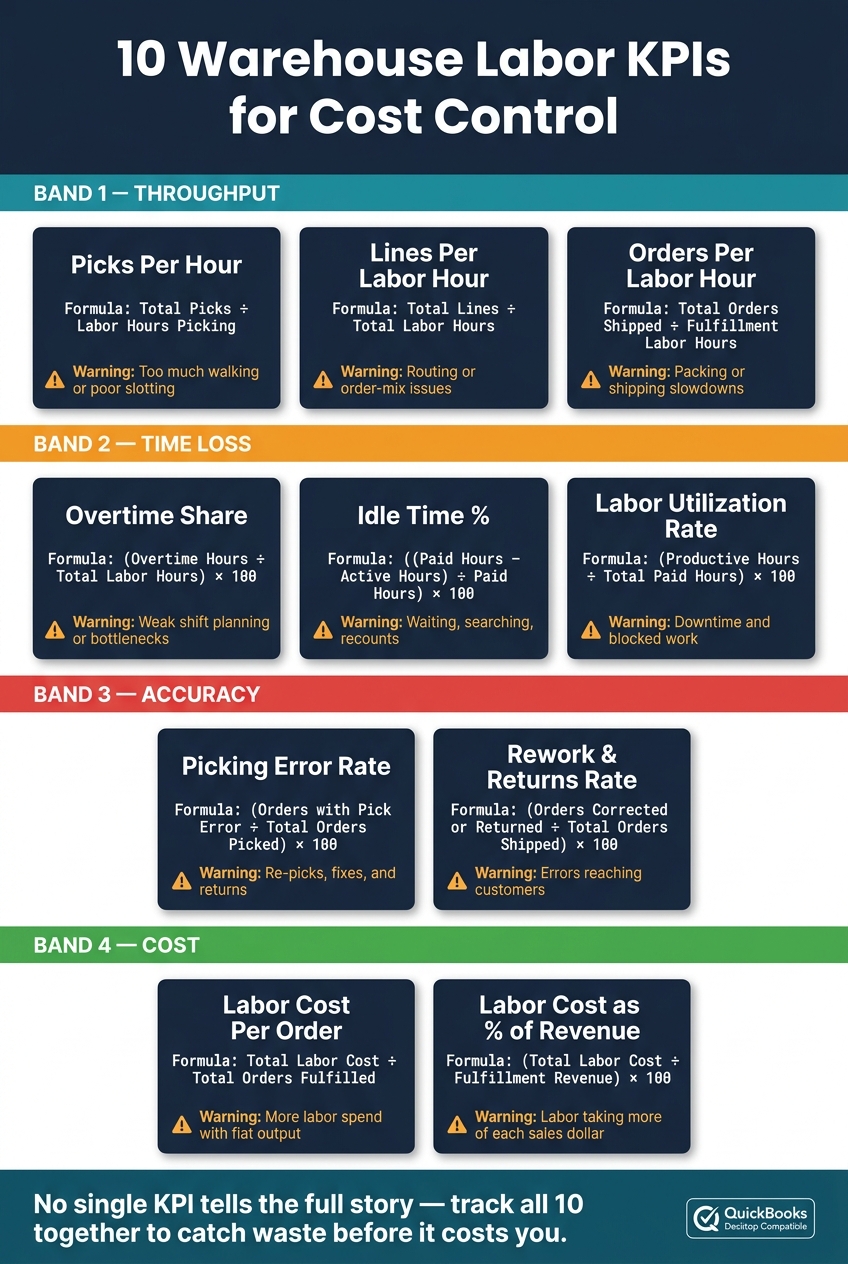
10 Warehouse Labor KPIs: Formulas, Waste Signals & Staffing Actions
The Top 16 Warehouse KPIs to Elevate Your Business
sbb-itb-19ed50f
Quick Comparison
| KPI | What it tells me | Main warning sign |
|---|---|---|
| Picks Per Hour | Item pick speed | Too much walking or poor slotting |
| Lines Per Labor Hour | SKU-line output per hour | Routing or order-mix issues |
| Orders Per Labor Hour | Shipped order throughput | Packing or shipping slowdowns |
| Overtime Share | Extra paid hours | Weak shift planning or bottlenecks |
| Idle Time % | Paid time not spent on work | Waiting, searching, recounts |
| Picking Error Rate | Pick accuracy problems | Re-picks, fixes, and returns |
| Labor Cost Per Order | Fulfillment labor cost per order | More labor spend with flat output |
| Labor Cost as % of Revenue | Labor spend vs. fulfillment revenue | Labor taking more of each sales dollar |
| Labor Utilization Rate | Paid time used on tasks | Downtime and blocked work |
| Rework and Returns Rate | Cost from labor mistakes | Errors reaching customers |
Bottom line: I wouldn’t look at one KPI by itself. A team can pick fast and still lose money through errors, overtime, or rework. The article lays out how each KPI works, what it points to, and how QuickBooks Desktop users can tie floor activity to payroll and financial reports.
Why Labor KPIs Matter for Staffing and Cost Control
Labor KPIs help you spot pressure points fast. They show where staffing is stretched, where work starts to drag, and where money slips away. That makes them useful for planning headcount, keeping overtime in check, and tracking labor spend.
If labor cost per order starts to climb, it's smart to step in before that increase rolls into your monthly fulfillment cost.
Higher volume creates a staffing call. When line volume goes up, you need to decide what makes the most sense: add headcount, cross-train staff, or fix the workflow first.
Use weekly reports to catch short-term spikes. Use monthly reports to spot patterns that keep showing up.
| KPI Trend | Staffing Action |
|---|---|
| Low picks per labor hour | Identify training gaps or move fast-moving items closer to the packing area |
| High idle time percentage | Adjust schedules or reallocate workers to different zones |
| Rising line volume | Evaluate whether to hire or optimize existing workflows |
| High error rates in specific zones | Cross-train staff or add scan-validation steps |
| Overtime share climbing week over week | Rebalance shift planning and task allocation |
This kind of tracking turns labor data into day-to-day decisions. A drop in picks per labor hour, for example, may point to a training issue. Or it may mean your layout is slowing people down. High idle time can signal weak scheduling. Rising overtime share can hint that shift planning is off before payroll costs get out of hand.
1. Picks Per Hour
Definition
Picks per hour measures picking output during active picking time.
Formula
Picks Per Hour = Total Number of Picks ÷ Total Labor Hours Spent Picking
Only count time spent picking. Leave out breaks, receiving, and packing. Use scan-validated picks so each worker is measured the same way.
This KPI shows what’s happening on the warehouse floor, not just what shows up in payroll.
How It Reveals Labor Waste
Once you know how many picks each labor hour produces, the next step is figuring out where time is slipping away.
A low rate often points to too much walking, poor slotting, or re-picks caused by bad labeling. One simple fix is to use order history to place fast-moving items closer to packing stations. That cuts travel time and can lift picks per hour without adding headcount. Regular re-slotting helps keep that improvement in place as demand changes.
Picks per hour works best when you pair it with layout and travel-time data, because that’s how you spot where labor is getting eaten up.
Staffing Impact for QuickBooks Desktop Users
For QuickBooks Desktop users, this KPI turns scan data into a plain staffing signal: if picks per hour starts to fall, the issue may be slotting, training, or shift balance.
Start with picks per hour because it’s the fastest way to see if warehouse labor is productive or drifting into waste.
Next, look at line-based productivity to see if that speed holds across full orders and broader warehouse work.
2. Lines Per Labor Hour
Definition
If picks per hour shows speed on individual items, lines per labor hour shows how well your team moves through distinct SKUs.
This metric tracks how many order lines your warehouse staff processes in one labor hour. A line means one SKU on an order, no matter how many units get picked. That’s the big difference from picks per hour: this KPI looks at distinct SKUs, so it gives you a clearer view of location changes, walking time, and route flow.
Formula
Lines Per Labor Hour = Total Lines Processed ÷ Total Labor Hours
Use labor hours that match the task you’re measuring, such as picking, packing, or receiving.
How It Reveals Labor Waste
When lines per labor hour is low, workers are often spending too much time walking, hunting for items, or moving through poor routes. That makes this KPI a solid way to check whether your slotting, batch size, and travel paths are helping or slowing things down.
Staffing Impact for QuickBooks Desktop Users
QuickBooks Desktop gives you payroll and time records, which cover the labor-hours side of the formula. The hard part is getting accurate line counts from the warehouse floor, because QuickBooks is the financial system of record, not the execution layer.
That’s where mobile barcode scanning comes in. If lines per labor hour drops during a certain shift, that’s a clear sign to look at shift coverage, slotting, batch picking, or training. Rapid Inventory can record line activity through mobile barcode scanning and tie it back to your QuickBooks workflow.
Used alongside picks per hour, this KPI helps you spot whether labor time is being lost to travel, routing, or order complexity.
3. Orders Per Labor Hour
Definition
After item and line speed, OPLH tells you whether that effort is turning into completed orders. Orders per labor hour (OPLH) measures how many shipped orders your team completes for each labor hour worked.
Formula
Orders Per Labor Hour = Total Orders Shipped ÷ Total Labor Hours
Only count shipped orders. For labor hours, use fulfillment labor hours only. Leave out receiving and returns processing.
How It Reveals Labor Waste
If picks per hour still looks strong but OPLH drops, the slowdown usually shows up in packing, staging, or shipping. In plain terms, the team may be picking fine, but orders still aren’t getting out the door fast enough.
A drop in OPLH can also point to too much walking, floor congestion, or poor slotting. That’s why OPLH is often the next metric to check after pick and line productivity when you’re trying to spot the actual fulfillment bottleneck.
Staffing Impact for QuickBooks Desktop users
Use OPLH to catch throughput dips early and move labor to packing or shipping before backlog starts to build.
4. Overtime Share of Labor Hours
If throughput stays flat but payroll keeps climbing, overtime is often the first thing to check.
Definition
Overtime share of labor hours shows what percent of your total weekly labor hours are paid at overtime rates. In plain English, it tells you how often your team is working past scheduled shifts.
Formula
Overtime Share = (Overtime Hours ÷ Total Labor Hours) × 100
Example: 60 overtime hours out of 400 total labor hours = 15%.
How It Reveals Labor Waste
A high overtime share can point to bottlenecks, poor slotting, manual count checks, and extra walking. Those problems add labor hours to the same amount of work and can push teams into overtime.
Staffing Impact for QuickBooks Desktop Users
QuickBooks Desktop tracks overtime cost, but not the cause. Pair it with mobile barcode scanning and labor dashboards so you can redistribute work before overtime grows.
Before you add another shift, test whether re-slotting fast-moving items closer to packing can cut overtime.
If overtime is climbing, check idle time next to see where shift hours are being lost.
5. Idle Time Percentage
Definition
Idle time percentage shows how much of your paid labor time is not spent on productive warehouse work.
Formula
Idle Time % = ((Total Paid Labor Hours − Total scan-confirmed active hours) ÷ Total Paid Labor Hours) × 100
Example: If your team logs 400 paid hours in a week but only 300 hours are confirmed as productive, idle time is 25%.
How It Reveals Labor Waste
Idle time usually comes from extra walking, stock searches, and recounts caused by poor slotting or bad inventory data. It adds up fast. People are on the clock, but that time isn't moving orders out the door.
When slotting is off or inventory records start slipping, idle time tends to creep up in the background. Labor cost goes up, but shipped orders don't. That's why this metric can act as an early warning sign before picking mistakes and other errors start showing up.
Staffing Impact for QuickBooks Desktop Users
QuickBooks Desktop shows payroll totals, but it doesn't show what happened during those paid hours. So idle time can sit there unnoticed.
When you connect QuickBooks Desktop to scan-validated workflows, you get time-stamped activity records that show where productive hours are going - and where they're not. Tools like Rapid Inventory add mobile scanning and real-time reports to QuickBooks Desktop, which makes idle time visible on the warehouse floor.
Next, measure how often that lost time turns into warehouse mistakes through picking error rate.
6. Picking Error Rate
When idle time goes up, pick mistakes usually show up right behind it.
Definition
Picking error rate shows how often workers pick the wrong item, the wrong quantity, or skip a needed label or scan.
For QuickBooks Desktop users, the main issues to track are:
- Mispicks
- Wrong quantities
- Missing labels
- Serial-number errors
Formula
Picking Error Rate = (Number of Orders with a Pick Error ÷ Total Orders Picked) × 100
How It Reveals Labor Waste
Every mispick sets off extra work. Someone has to re-pick the order, put stock back, repack the shipment, and make manual fixes in QuickBooks Desktop. That means the same order gets handled twice.
And if the error makes it into QuickBooks, the cleanup gets even slower. Now you're dealing with manual reversals and ledger adjustments instead of fixing the problem on the warehouse floor. That takes more time and adds friction where you least want it.
There’s another cost, too: repeated mistakes chip away at confidence in your inventory records. When that happens, teams start doing extra counts before shipping just to make sure the data is right.
Staffing Impact for QuickBooks Desktop Users
High error rates often point to manual pick sheets instead of scan-based workflows. When managers track errors by zone or shift, they can spot where the problem starts. Maybe a team needs retraining. Maybe the slotting layout is making picks harder than they should be. Or maybe scan discipline is slipping.
Rapid Inventory adds mobile barcode scanning to QuickBooks Desktop workflows, which helps stop pick errors before bad data reaches the ledger.
Those mistakes also create rework and returns, which the next KPI tracks.
7. Labor Cost Per Order
Definition
Labor cost per order is the total labor spend needed to fulfill one order, including picking, packing, shipping, and rework.
Formula
Labor Cost Per Order = Total Labor Cost ÷ Total Number of Orders Fulfilled
Unlike the time and accuracy metrics in KPIs 4–6, this one is a dollar-per-order metric. It turns warehouse activity into a plain cost number.
How It Reveals Labor Waste
This KPI shows where labor hours turn into cost per order. If labor cost per order goes up while order volume stays flat, it usually points to extra walking, recounts, poor slotting, or rework.
Slotting is a common cause. When high-velocity items sit far from the packing area, workers spend more time walking for each order. That added travel pushes more dollars into every fulfillment cycle. One clear fix is to run an ABC analysis on order history and move fast-moving SKUs closer to pack stations. You can see the cost effect here before it shows up in payroll reports.
Staffing Impact for QuickBooks Desktop Users
Once you’ve tracked speed, accuracy, and idle time, this dollar metric shows the money side of the story. It helps you tell the difference between overtime you actually need and waste you can cut during peak periods. It also helps answer a practical staffing question: should you add headcount, or should you clean up the workflow first?
Rapid Inventory’s mobile barcode scanning helps QuickBooks Desktop users record scan-validated labor data from the warehouse floor.
Next, compare labor cost with fulfillment revenue to see how much of each sales dollar goes to labor.
8. Labor Cost as a Percentage of Fulfillment Revenue
Definition
If labor cost per order tells you the cost of each shipment, this KPI shows something different: how labor spend grows or shrinks against fulfillment revenue.
It compares total labor cost to the revenue tied to fulfillment:
Labor Cost as a % of Fulfillment Revenue = (Total Labor Cost ÷ Total Fulfillment Revenue) × 100
In QuickBooks Desktop, you can calculate it by pulling:
- Total labor costs from payroll or COGS accounts
- Total fulfillment revenue from sales or income accounts
Clean account setup matters here. If costs or revenue are posted to the wrong places, the percentage will be off.
How It Reveals Labor Waste
When this percentage goes up while revenue stays flat, that's often a sign of labor waste.
In plain terms, the team is spending more time and money, but the business isn't bringing in more fulfillment revenue. That extra labor usually comes from avoidable work like searches, recounts, relabeling, and manual fixes.
Staffing Impact for QuickBooks Desktop Users
A high labor share often points to workflow waste, not a need for more headcount.
That distinction matters. Adding people to a messy process usually just makes the mess more expensive. Scan-validated mobile workflows can cut labor hours without adding headcount. And mobile barcode scanning helps keep labor-related data checked and recorded inside QuickBooks.
9. Labor Utilization Rate
Definition
Labor cost share tells you what labor costs. Utilization tells you whether you're getting work from the time you're already paying for.
Labor utilization rate measures the share of paid time spent on warehouse tasks. Unlike picks per hour, this metric looks at how much paid time is actually used. It sits between time loss and output, which makes it useful for spotting whether labor is being used at all.
Formula
Labor Utilization Rate = (Productive Labor Hours ÷ Total Labor Hours Paid) × 100
Productive hours include active fulfillment tasks. Non-productive hours include waiting, downtime, and time lost to bottlenecks.
How It Reveals Labor Waste
A low utilization rate is a red flag. It usually means paid time is slipping away through walking, waiting, or searching.
That matters because people can be on the clock without moving orders forward. On paper, staffing may look fine. On the floor, though, too much of that paid time may be getting eaten up by delays.
Staffing Impact for QuickBooks Desktop Users
QuickBooks Desktop tracks labor cost, but it doesn't track floor activity. So if you want utilization, labor cost data alone won't get you there. You need scan-level data from the warehouse floor.
To measure it with any accuracy, you need a mobile scanning layer that records picks, moves, and counts in real time. That mobile layer can buffer scans and sync validated transactions back to QuickBooks Desktop.
Rapid Inventory's mobile barcode scanning and real-time inventory reports help QuickBooks Desktop users track that activity and connect labor hours to orders shipped.
If utilization is low because of errors, the next metric shows how that lost time turns into rework and returns.
10. Rework and Returns Caused by Labor Errors
Definition
This KPI measures the labor cost of fixing warehouse mistakes.
Rework means the internal labor used to correct errors before a shipment leaves the facility. Returns means returns caused by warehouse mistakes, such as the wrong item, the wrong quantity, or handling damage.
Taken together, this KPI tracks correction labor and return cost tied to errors like mispicks, quantity errors, labeling errors, and handling damage. It shows, in plain terms, how labor mistakes turn into extra warehouse hours and higher fulfillment cost.
Formula
Track it as a rework-and-returns rate:
Rework and Returns Rate = (Orders requiring correction or returned for labor error ÷ Total Orders Shipped) × 100
You can also estimate the dollar impact:
Cost of Rework = Reprocessing labor + return shipping + wasted packaging
How It Reveals Labor Waste
Every mistake sets off extra work. Someone has to fix the order, deal with wasted packaging, and often process the return too.
That lost labor doesn't always stand out right away. It can sit inside total fulfillment hours and make labor cost look high without showing why.
The main issue here is the cost that follows the error: returns, write-offs, and correction work. Not just the act of re-picking. When error rates go up, the damage spreads into accounting adjustments, inventory write-offs, and return handling costs that are much harder to clean up than the first mistake.
Staffing Impact for QuickBooks Desktop Users
In QuickBooks Desktop, rework often shows up through adjustments, reversals, and write-offs. QuickBooks Desktop acts as the system of record for financial results, but it doesn't always show live warehouse activity.
A mobile warehousing layer can help by holding these events until the data is checked, so only accurate entries reach the QuickBooks ledger. Rapid Inventory offers mobile barcode scanning and two-way QuickBooks sync, which works well in a scan-verified workflow.
Use these error costs to trace where labor waste turns into write-offs, reversals, and return handling inside QuickBooks Desktop.
Next, connect these error costs to payroll, returns, and inventory adjustments in QuickBooks Desktop.
How to Track Labor KPIs Using QuickBooks Desktop
To track these KPIs the right way, split financial data in QuickBooks from warehouse activity on the floor.
QuickBooks Desktop handles the money side of the equation: payroll, sales orders, invoices, and credit memos. But it stops short when you need floor-level activity data. It doesn't natively track shift-level pick counts or how long someone worked at the receiving dock. That part needs to come from a warehouse workflow system or scan logs.
It also helps to define hours before you run any math.
- Paid hours come from payroll
- Productive hours come from scan-verified warehouse tasks
Use paid hours for cost KPIs. Use productive hours for efficiency KPIs. That small distinction matters a lot. If you mix them up, your numbers can tell the wrong story.
Use the table below to pair each KPI with the right QuickBooks field and warehouse data source.
| KPI | QuickBooks Desktop Source | Warehouse Activity Source |
|---|---|---|
| Picks Per Hour | Payroll (labor hours) | Scan/pick logs |
| Lines Per Labor Hour | Sales order lines / invoices | Payroll (labor hours) |
| Labor Cost Per Order | Payroll (total cost) | Sales Orders (total count) |
| Picking Error Rate | Credit Memos (returns) | Order/shipment logs |
| Labor Utilization Rate | Payroll (paid hours) | Task logs (productive hours) |
After that, review KPIs from a few different angles: by shift, day, week, month, warehouse, customer, and channel.
Shift and day views help you spot problems fast, like idle time spikes, bottlenecks at one dock, or a dip in picks per hour during a certain part of the day. Week and month views are better for staffing calls. Warehouse-level views make it easier to compare locations. Customer and sales channel views can show which accounts or channels lead to more rework or higher mispick rates.
Once your data sources are set, the next step is simple: capture warehouse activity the same way every time. Rapid Inventory fills that gap with mobile barcode scanning, two-way QuickBooks sync, and real-time inventory reports.
KPI Comparison Tables
These comparisons make it easier for QuickBooks Desktop users to line up labor data with staffing and cost control. The goal is simple: pick the KPI that fits the warehouse job you’re trying to measure.
Use these three throughput KPIs to match the metric to the work on the floor.
| KPI | What It Measures | Best Use Case |
|---|---|---|
| Picks Per Hour | Individual item retrieval speed | High-volume e-commerce with single-item orders |
| Lines Per Labor Hour | Unique SKUs (order lines) processed per hour | B2B or wholesale with complex, multi-item orders |
| Orders Per Labor Hour | Total completed and packed orders | Fulfillment capacity planning |
Not every warehouse moves work the same way. A team shipping lots of one-item orders will care more about Picks Per Hour. A business handling larger, mixed orders will usually get a better read from Lines Per Labor Hour. And if you need to gauge how many orders the operation can finish, Orders Per Labor Hour gives you that view fast.
After throughput, it helps to look at accuracy and rework side by side.
Use these two KPIs to separate pick-point errors from customer-facing rework.
| Error-Focused KPI | Focus | What It Reveals |
|---|---|---|
| Picking Error Rate | Pick-point accuracy | Where errors enter the fulfillment process |
| Rework and Returns Caused by Labor Errors | Customer-facing rework | Where errors reach the customer |
This distinction matters. Picking Error Rate shows where mistakes begin inside the process. Rework and Returns Caused by Labor Errors shows when those mistakes slip through and affect the customer. One points to the source of the issue; the other shows the downstream cost.
Then compare the cost metrics to see how labor turns into dollars.
Cost KPIs show whether labor spending is keeping pace with output and revenue.
| KPI | Formula | Waste Signal | Staffing Implication |
|---|---|---|---|
| Labor Cost Per Order | Total labor cost ÷ Total Orders Fulfilled | Rising cost per order with steady volume | Shows whether labor spend is rising faster than output |
| Labor Cost as % of Fulfillment Revenue | (Total labor cost ÷ Total Fulfillment Revenue) × 100 | Labor rising faster than revenue | Signals schedule changes, temp labor for peaks, or cross-training |
These cost metrics answer a practical question: are you spending more labor dollars without getting more out the door? Labor Cost Per Order helps track whether output is keeping up with payroll. Labor Cost as % of Fulfillment Revenue shows whether labor cost is eating up more of each revenue dollar, which can point to schedule shifts, added temp help during peak periods, or a need for cross-training.
Conclusion
The main takeaway is simple: no single KPI can show warehouse labor performance by itself. A strong picks-per-hour number doesn't mean much if error rates go up and rework piles on. These KPIs are more than measurements. They're decision tools that help keep staffing and cost control tied to actual data.
Used together, these KPIs bring hidden waste into view across productivity, cost, and accuracy.
Once your KPIs are set, the next move is connecting scan data to QuickBooks Desktop. If you use QuickBooks Desktop, this affects COGS and period closes. Validated scan data helps keep both accurate. Tools like Rapid Inventory record barcode-scanned transactions at the point of work and sync that data with QuickBooks Desktop. Start with one workflow and one or two KPIs. Then replace manual counts with scan-validated tracking so you can catch waste early and back up staffing decisions with facts.
Track the right mix of KPIs, and you can spot labor problems before they cost you money.
FAQs
Which warehouse labor KPIs should I track first?
Start with the metrics that have the biggest impact on order quality and day-to-day output. Put pick accuracy first, then watch lines per labor hour and perfect order rate to get a clear read on productivity.
From there, track error rates, travel time, and transaction times. That gives you a baseline, shows where work slows down, and helps you spot bottlenecks before they turn into bigger problems. Rapid Inventory’s real-time reports can help you keep an eye on these metrics across your warehouse network.
How often should I review warehouse labor KPIs?
Review warehouse labor KPIs weekly to keep operations running smoothly. A regular check on metrics like pick accuracy, lines per hour, and error rates helps you catch disruptions, shifts in customer demand, and staffing problems early.
For areas that need fast action - like daily productivity or system integrations - supervisors should rely on real-time dashboards to make mid-shift adjustments.
What data do I need from QuickBooks Desktop and the warehouse floor?
You need two kinds of data here: financial data from QuickBooks Desktop and day-to-day activity data from the warehouse floor.
From QuickBooks Desktop, that means order and inventory details like customer information, order dates, item numbers, quantities, shipping addresses, and inventory costs.
From the warehouse floor, you need real-time barcode-scanned activity data, including bin locations, lot or serial numbers, and the actual time spent on picking, packing, and cycle counting.