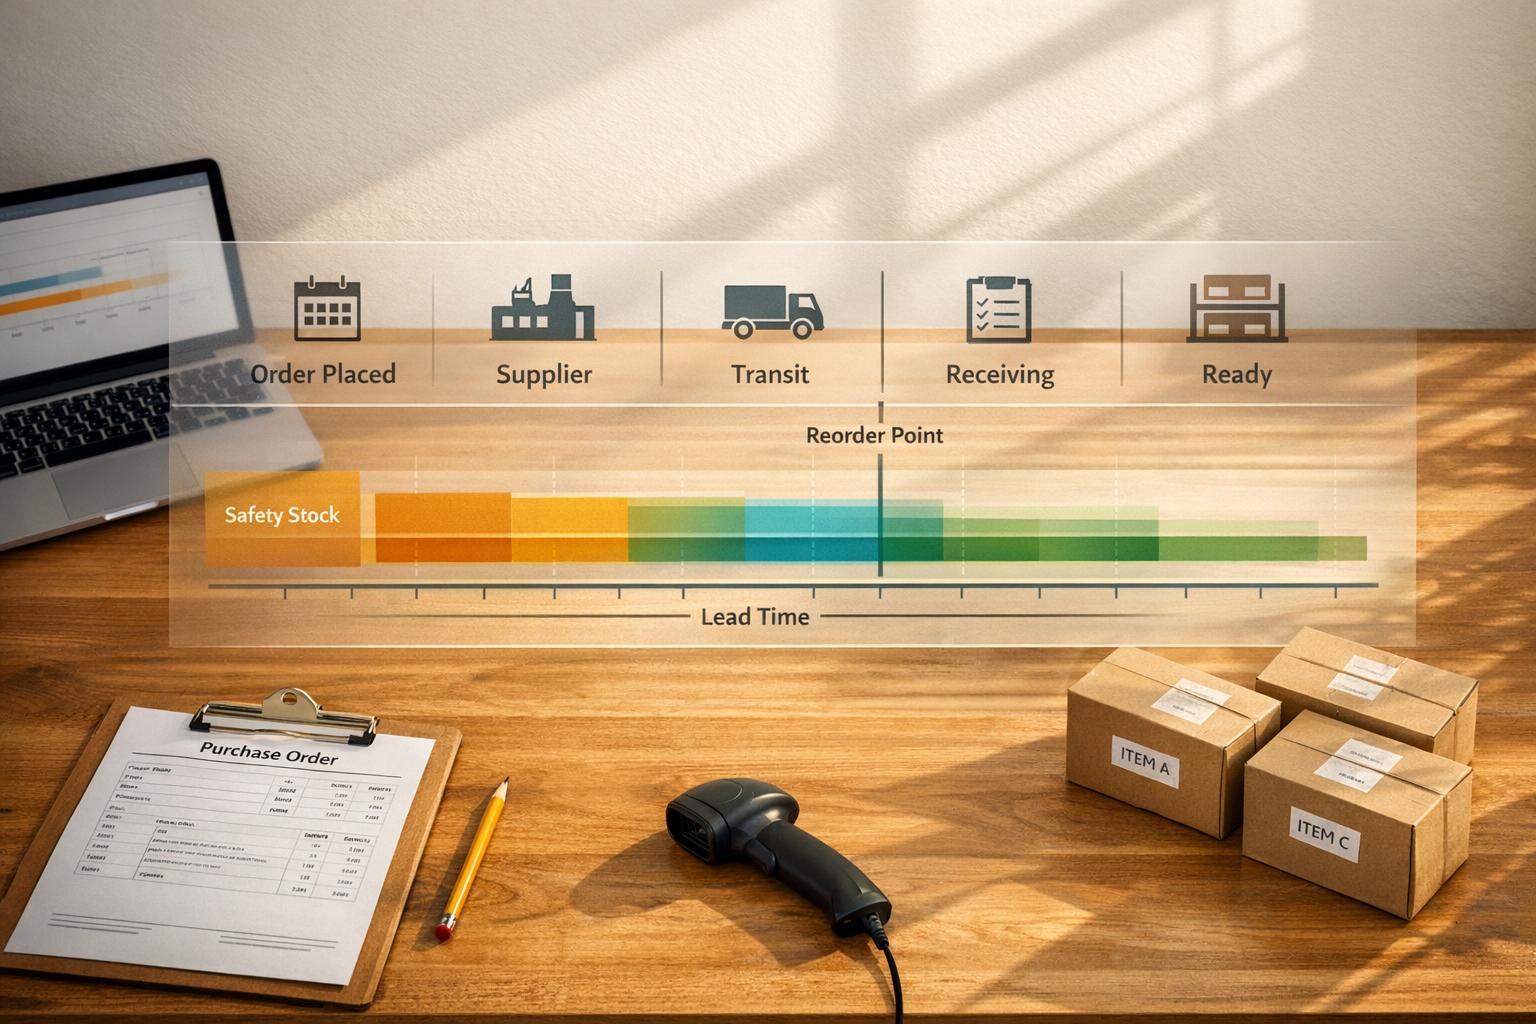
Lead time is the time it takes from placing a purchase order to having goods ready for sale. It directly impacts your inventory decisions, such as when to reorder and how much safety stock to keep. Miscalculating lead time can lead to stockouts or excess inventory, both of which hurt your business.
Here’s what you need to know:
-
Lead Time Formula:
Lead Time (days) = Date Goods Available − Purchase Order Date
Always include all steps, like order processing, production, shipping, and inspection. -
Why It Matters:
Accurate lead time ensures you reorder on time and maintain optimal stock levels. Variability in lead times can disrupt planning and require higher safety stock. -
Key Components:
- Reordering Delay: Time taken internally to approve and send orders.
- Supply Delay: Time the supplier takes for processing, production, shipping, and your receiving process.
-
Tracking Tips:
- Measure lead time for each item and supplier separately.
- Use historical data (20+ orders) to calculate averages and variability.
- Monitor fluctuations with metrics like standard deviation and Coefficient of Variation (CV).
-
Reorder Point Formula:
ROP = (Average Daily Sales × Lead Time) + Safety Stock
Adjust for lead time variability using precise safety stock formulas.
To improve accuracy, rely on historical data, not supplier estimates, and use inventory management software to automate calculations and track performance over time.
Key Components of Lead Time
Reordering Delay vs. Supply Delay
Lead time is made up of two main parts: reordering delay and supply delay. Understanding who controls each part is crucial for addressing potential delays.
Reordering delay refers to the time it takes within your organization to identify the need for an order, get the necessary approvals, and officially send a purchase order to the supplier. This part is entirely within your control. On the other hand, supply delay covers everything that happens after the order is sent. This includes the supplier's processing, production, shipping, and your own receiving process.
"A supplier who says 'ships in 5–7 days' might have a true lead time of 12–14 days once you account for processing on both ends." - Sensible Tools
The key takeaway here? A supplier's quoted shipping time often doesn’t reflect the full lead time. Internal and external delays can add extra days, so it’s essential to factor in these hidden components.
Breaking Down Supply Delays
Supply delay isn’t a single step - it’s made up of several stages, each with its own responsibilities:
| Component | Responsibility | What It Includes |
|---|---|---|
| Order Processing | Supplier | Acknowledging the purchase order and entering it into their system |
| Production/Fulfillment | Supplier | Manufacturing the item or picking and packing it |
| Transit | Logistics/Carrier | Physical shipping, including customs clearance for international shipments |
| Receiving & Inspection | Internal (Warehouse) | Ensuring goods are ready for sale - often one of the most time-consuming steps |
Internal processes, particularly receiving and inspection, can make up 20–40% of the total lead time. Overlooking this step can lead to miscalculations when planning reorders.
By breaking down these steps, you can track delays more accurately for each item and supplier.
Tracking Lead Time by Item and Supplier
One common mistake in inventory planning is treating lead time as a fixed number for an entire supplier. In reality, lead times can vary widely depending on the item. For instance, a supplier might deliver standard items in 7 days but take 21 days for custom orders.
To get precise data, track three critical dates for every purchase order:
- Order Placement Date: When the purchase order is sent.
- Arrival Date: When the goods arrive at your location.
- Availability Date: When the inventory is ready for sale.
The time between the first and last date represents the true lead time.
It’s also important to monitor variability, not just averages. For example, two suppliers might both average 14 days, but one might fluctuate between 7 and 21 days, while the other stays consistent between 13 and 15 days. For planning purposes, these two suppliers are not the same.
"Lead time variability is often more important than lead time length when calculating safety stock." - Sumtracker
A real-world example: In 2026, Time Manufacturing implemented real-time supplier visibility for open purchase orders. This resulted in a 98% production attainment rate and a 67% improvement in demand visibility. This success highlights the value of pinpointing delays at every stage - by item, supplier, and process.
Breaking down these components is essential for calculating lead times with precision.
sbb-itb-19ed50f
PART 1 of 2: Calculating Lead Times that We Need for the Safety Stock / Reorder Point Template
How to Calculate Lead Time: Step-by-Step
How to Calculate Lead Time for Inventory Planning
To manage inventory effectively, you need an accurate method for calculating lead time. These calculations are crucial for determining reorder points and safety stock levels, ensuring you stay ahead of demand.
The Basic Lead Time Formula
Here's the formula you'll use:
Lead Time (days) = Date Goods Available in Stock − Purchase Order Date
The word available is key here. This refers to the date when the goods are ready for use or sale - not just when they physically arrive. Why? Because additional steps like receiving and inspection can add days to the process. Ignoring this can lead to underestimating your lead time, which might result in late reorders.
For example, if you placed a purchase order on May 1 and the goods became available on May 18 after inspection, your lead time is 17 days.
How to Calculate Average Lead Time
To create a reliable baseline, you need to look at historical data rather than relying on a single order. This involves calculating the lead time for multiple completed purchase orders and averaging them.
"Reducing lead time variability often has a bigger impact on lowering inventory levels than reducing the average lead time by a few days." - BoxHero
For meaningful results, aim to analyze at least 20–30 completed orders for a specific item-supplier combination. If you can gather data from 50 or more orders, you'll get even better accuracy. While using data from just 3–5 recent orders might suffice in a pinch, it leaves you vulnerable to outliers skewing your metrics.
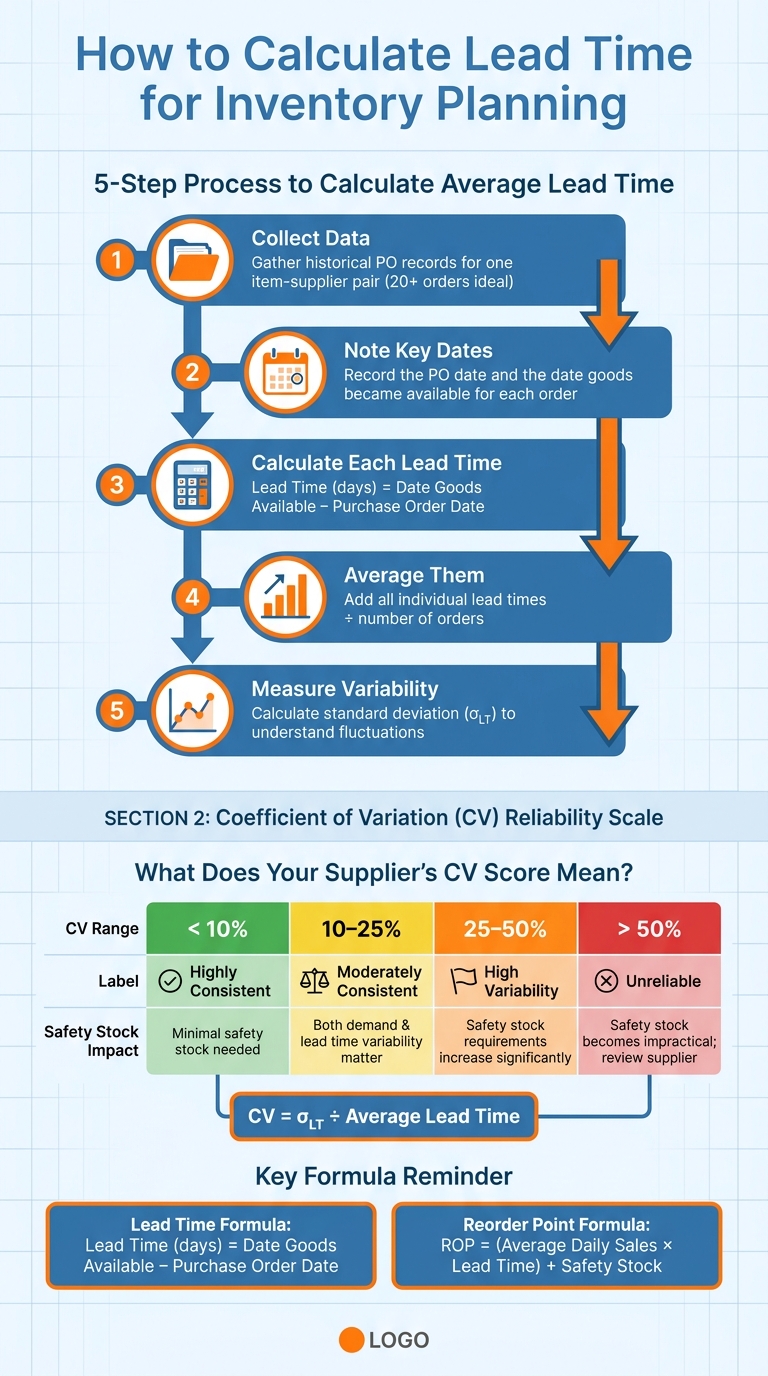
Here's the process:
| Step | Action |
|---|---|
| 1. Collect data | Gather historical purchase order records for one item-supplier pair (20+ orders are ideal). |
| 2. Note key dates | Record the PO date and the date goods became available for each order. |
| 3. Calculate each LT | Subtract the PO date from the availability date to find the lead time for each order. |
| 4. Average them | Add up all the individual lead times and divide by the number of orders. |
| 5. Measure variability | Calculate the standard deviation to understand fluctuations in lead times. |
It's important to segment your data by both item and supplier. For instance, a supplier might deliver standard parts in 7 days but take 21 days for custom components. Combining these into one average hides potential planning issues.
Once you have the average lead time, the next step is to assess variability to refine your planning.
Handling Variability in Lead Times
While the average lead time gives you a baseline, variability shows how reliable that number is. This is often more critical for effective planning.
For each item-supplier pair, track the minimum, maximum, and average lead times. Then, calculate the standard deviation (σLT) to measure how much lead times vary. A quick way to gauge supplier reliability is by using the Coefficient of Variation (CV), which you calculate as:
CV = σLT ÷ Average Lead Time
Here’s what the CV tells you:
| CV Range | Assessment | Planning Impact |
|---|---|---|
| < 10% | Highly consistent | Minimal safety stock needed for lead time. |
| 10–25% | Moderately consistent | Both demand and lead time variability matter. |
| 25–50% | High variability | Safety stock requirements increase significantly. |
| > 50% | Unreliable | Safety stock becomes impractical; supplier review needed. |
If a supplier's CV is over 50%, the issue goes beyond inconvenience - it makes accurate planning nearly impossible. At that point, it's better to address the root cause of the variability instead of overcompensating with excessive safety stock.
Using Lead Time to Set Reorder Points and Safety Stock
Once you've calculated lead time and its variability, you can use this information to set critical inventory thresholds. These thresholds - reorder point (ROP) and safety stock - help ensure you maintain optimal stock levels and avoid disruptions.
Reorder Point Formula
The reorder point is the inventory level at which you need to place a new order. Here's the formula:
ROP = (Average Daily Sales × Lead Time) + Safety Stock
For example, if your daily sales average 50 units, your lead time is 14 days, and your safety stock is 200 units:
ROP = (50 × 14) + 200 = 900 units.
This ensures you have enough inventory to cover the entire lead time, from order placement to delivery.
"The real culprit [of stockouts] could be your lead time in inventory management." - Gitanjali Chettri, SaaS and ERP Expert
Adjusting Safety Stock for Lead Time Variability
When lead times fluctuate, you need a more precise calculation for safety stock. This formula incorporates variability:
Safety Stock = Z × √[(LT × σd²) + (D² × σLT²)]
Here’s what each variable means:
- Z: The Z-score for your desired service level (explained below),
- LT: Average lead time,
- σd: Standard deviation of daily demand,
- D: Average daily demand,
- σLT: Standard deviation of lead time.
If detailed standard deviation data isn't available, you can estimate it using:
σ ≈ (max − min) ÷ 4.
The Z-score you choose depends on your desired service level:
| Service Level | Z-Score | Best Used For |
|---|---|---|
| 90% | 1.28 | Low-priority or slow-moving items |
| 95% | 1.65 | Most standard retail products |
| 99% | 2.33 | Critical items where stockouts are costly |
Most businesses find a 95% service level (Z = 1.65) works well for general inventory, while higher service levels are better for high-margin or fast-moving products. For accuracy and efficiency, automating these calculations is highly recommended.
Automating Reorder Points with Inventory Software
Manually calculating ROPs becomes cumbersome as your inventory grows or demand fluctuates. Automating these calculations with inventory software ensures timely reordering and reduces manual effort.
"A static reorder point gets stale within months. The right system recomputes ROP daily from rolling consumption data." - LineNow Team
Rapid Inventory is a tool designed to simplify this process. It integrates directly with QuickBooks Desktop, pulling sales velocity and purchase order history into one system. When your stock hits the reorder point, the system automatically flags the item for reordering.
Most automated systems follow straightforward logic:
IF current stock ≤ reorder point AND no open purchase order exists, THEN create a purchase order.
This kind of automation eliminates the need for constant manual checks, keeping your inventory replenishment efficient and error-free.
Improving Lead Time Data for Better Forecasting
Common Problems with Lead Time Measurement
Accurate forecasting hinges on high-quality data, but lead time measurement often falls short due to common pitfalls. One major issue is treating lead time as a fixed figure. In reality, it fluctuates based on factors like supplier workload, seasonal demand, and changing logistics conditions. Another frequent error is relying on supplier-quoted shipping times instead of historical data. Supplier quotes typically focus on transit time, overlooking critical phases like order processing, receiving, and inspection. This can lead to underestimations by two to three times the actual duration.
Internal delays also play a significant role. For instance, slow receiving processes can quietly add 20–40% to your total lead time without drawing attention. Incomplete timestamp records further compound the problem. If you're not logging the exact dates for when purchase orders are placed and when inventory becomes available for sale, your forecasts risk becoming little more than educated guesses.
"Your inventory system is only as reliable as the lead time data you put into it. Don't rely on assumptions." - Gitanjali Chettri, Kladana
Best Practices for More Consistent Lead Times
To improve lead time reliability, focus on historical purchase order data rather than supplier estimates. Track lead time at the item-supplier level since even products from the same vendor can have vastly different fulfillment timelines.
Consistency often matters more than speed. As BoxHero highlights: "Reducing lead time variability often has a bigger impact on lowering inventory levels than reducing the average lead time by a few days". For example, a supplier with less than 10% variability requires significantly less safety stock compared to a faster but inconsistent one. To account for unexpected delays, always round up lead times slightly. Additionally, review your lead time data quarterly or before peak seasons to detect shifts in supplier performance, helping you avoid stockouts.
| Supplier Consistency | Coefficient of Variation (CV) | Safety Stock Impact |
|---|---|---|
| Highly Consistent | < 10% | Minimal; demand variability dominates |
| Moderately Consistent | 10–25% | Meaningful buffer needed |
| High Variability | 25–50% | Can double or triple safety stock |
| Unreliable | > 50% | Safety stock becomes impractical |
These strategies help lay the groundwork for integrating technology that enhances data accuracy.
How Rapid Inventory Improves Lead Time Data Quality

Technology can further refine lead time measurement by automating data capture and minimizing errors. Tools like Rapid Inventory provide real-time insights, addressing overlooked internal stages that impact lead time.
For example, mobile barcode scanning eliminates delays between when goods arrive at the dock and when they’re recorded as available for sale. This can reduce the receiving and inspection phases, which often account for 10–20% of total lead time. Additionally, lot and serial number tracking brings greater precision by identifying delays at the batch or item level. With features like real-time reporting and QuickBooks Desktop integration, Rapid Inventory centralizes purchase order history, enabling businesses to calculate lead times based on actual data rather than assumptions.
"The real issue isn't just the variability. It's the gap between what's actually happening and what the planning system still believes." - GAINS
Conclusion
Lead time plays a critical role in every inventory decision - from determining when to reorder to setting safety stock levels. Managing lead times accurately ensures shelves stay stocked without tying up unnecessary cash. On the flip side, mistakes can result in stockouts or surplus inventory. Understanding this dynamic is the foundation of effective, data-driven inventory planning.
Key Takeaways
The biggest shift you can make is relying on actual historical data instead of supplier-quoted shipping times. Use real data that accounts for every stage of the process. Calculate lead times for each item and supplier individually rather than using one average figure for everything. Build in a buffer to your estimates, and don’t forget to review your lead time data quarterly. Supplier performance can change - especially as Q4 approaches - so your assumptions should adjust accordingly.
Tools like Rapid Inventory make this process easier. By automating data capture with mobile barcode scanning and integrating directly with QuickBooks Desktop, you can move from guesswork to precise, actionable insights. This ensures your reorder points and safety stock levels reflect reality, not just rough estimates.
"The real goal is predictability. Predictable timelines allow organizations to schedule production confidently, maintain stable inventory levels, and avoid costly expediting." - SourceDay
FAQs
Which dates should I use to measure lead time accurately?
To get an accurate measure of lead time, count the number of calendar days between when a purchase order is placed and when the inventory is physically ready for use. Use timestamps from historical purchase order data to pinpoint these dates. To ensure precision, analyze several completed orders to account for variations and factor in internal delays, such as supplier processing times, as part of the total lead time.
How do I handle lead time variability when setting safety stock?
To handle fluctuations in lead time effectively, you’ll need to calculate the standard deviation for both lead times and demand. The formula to determine safety stock is:
SS = Z × √(LT̄ × σD² + D̄² × σLT²)
Here’s what each term represents:
- LT̄: Average lead time
- σD: Demand variability
- D̄: Average demand
- σLT: Lead time variability
Using tools like Rapid Inventory can make this process easier by providing real-time data tracking. This helps you gain better insights into variability, allowing for more precise adjustments and improved accuracy in managing your inventory.
How often should I review and update my lead time assumptions?
Reviewing and updating your lead time assumptions every quarter is a smart move. Lead times often shift due to changes in demand or operational factors, and sticking to outdated figures can lead to inventory problems.
To stay ahead, regularly compare your actual performance data with historical receipt records. This will help you fine-tune both your averages and variability. For businesses using Rapid Inventory, these updates play a key role in ensuring precise planning and smoother workflows throughout your warehouse operations.