If your inventory data is off, your forecast is off. In QuickBooks Desktop, I can build a usable forecast by cleaning item records, checking stock reports, setting reorder points with a simple formula, and reviewing results every month.
Here’s the short version:
- I use sales history, quantity on hand, open POs, and lead times to estimate when to reorder.
- I set reorder points with this formula: average daily usage × lead time + safety stock.
- I check available quantity, not just on-hand stock, so I don’t count items already committed to sales orders.
- If I run more than one warehouse, I review stock by site before buying more.
- I compare forecast vs. actual sales each month and track MAPE, WAPE, and bias in a spreadsheet.
- I fix bad inputs first, like negative inventory, duplicate SKUs, wrong costs, and missed count adjustments.
A simple example: if an item sells 15 units per day and lead time is 10 days, the base reorder point is 150 units. If I keep 30 units as safety stock, I reorder at 180 units.
What this guide covers:
- QuickBooks Desktop inventory management software setup
- The reports to export and review
- Reorder point and safety stock math
- Site-level planning in QuickBooks Enterprise
- Barcode-driven stock updates
- A monthly and quarterly review routine
This guide is about turning QuickBooks Desktop data into a clear reorder process that helps cut stockouts, trim excess stock, and protect cash flow.
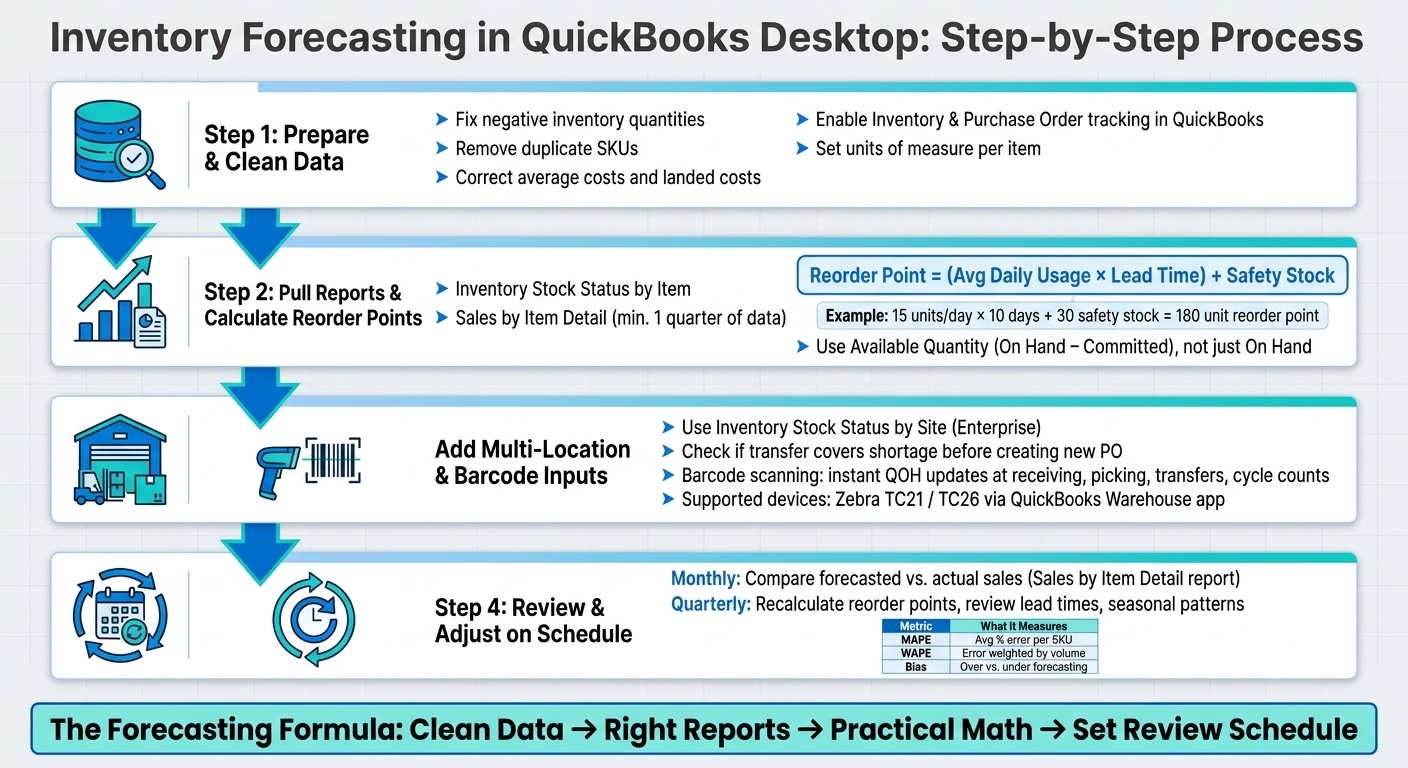
Inventory Forecasting in QuickBooks Desktop: Step-by-Step Process
1. Prepare QuickBooks Desktop For Reliable Forecasting

QuickBooks Desktop forecasting lives or dies on input quality. If item records are messy, counts are off, or settings aren't set right, the forecast will drift.
Start with the settings and item records that feed quantity, cost, and lead-time data into your forecast.
These inputs have the biggest effect on forecast accuracy:
Forecasting Inputs: Clean vs. Dirty Data
| Data Element | Impact if Accurate | Risk if Inaccurate |
|---|---|---|
| Quantity on Hand (QOH) | Forecast baseline | Stockouts or excess carrying costs |
| Reorder Points | Timely replenishment triggers | Emergency shipping costs or lost sales |
| Landed Costs | True margin forecasting | Skewed financials and underpriced products |
| Lead Times | Accurate stock arrival dates | Production halts and missed deadlines |
| Units of Measure | Consistent counting and ordering | Large count discrepancies |
| SKUs / Item Names | Clear demand trends | Stockouts from split sales history |
Turn On Inventory Tracking And Purchase Order Settings
Go to Edit → Preferences → Items & Inventory → Company Preferences and turn on Inventory and Purchase Orders are Active. Without it, QuickBooks won't track quantity on hand or produce the stock-level data your forecast needs.
If you're using QuickBooks Enterprise, open Advanced Inventory Settings and turn on Sites, Bins, Serial/Lot Numbers, FIFO, Barcodes, and Landed Cost. Landed Cost matters a lot here. It rolls freight, duties, and insurance into each item's cost, so your forecast reflects true cost of goods sold instead of just the purchase price.
Set Up Inventory Items, Units Of Measure, And Reorder Points
Fill out each inventory item record with SKU, location, cost, vendor, and unit of measure.
Reorder points deserve extra attention. Set them using average daily usage × lead time, then recalculate them every quarter. In QuickBooks Enterprise with Advanced Inventory turned on, you can manage reorder needs by location, so each warehouse or site has its own trigger. That's a lot better than using one number for every location.
Fix Inventory Problems Before You Start Forecasting
Run Inventory Valuation Summary and flag negative quantities and wrong average costs. Negative quantities need attention first. QuickBooks lets you filter for items where quantity on hand is below zero, which makes it easier to fix the worst issues first.
Duplicate item names are another common mess. When the same product sits under two names, sales history gets split, and that often leads to ordering too little.
After each cycle count, use Adjust Quantity/Value on Hand to fix variances. Then review Inventory Adjustment History each month for shrinkage or data-entry mistakes.
Once these inputs are clean, pull your sales and stock reports to build the forecast.
sbb-itb-19ed50f
2. Pull The Right QuickBooks Desktop Reports And Build A Simple Forecast
Once your inventory settings and item records are cleaned up, the next step is simple: pull the reports that show demand and what you can actually sell.
Use Stock And Sales Reports As Your Forecast Data Source
In QuickBooks Desktop, three reports do most of the heavy lifting for inventory forecasting:
- Inventory Stock Status by Item - your main stock snapshot
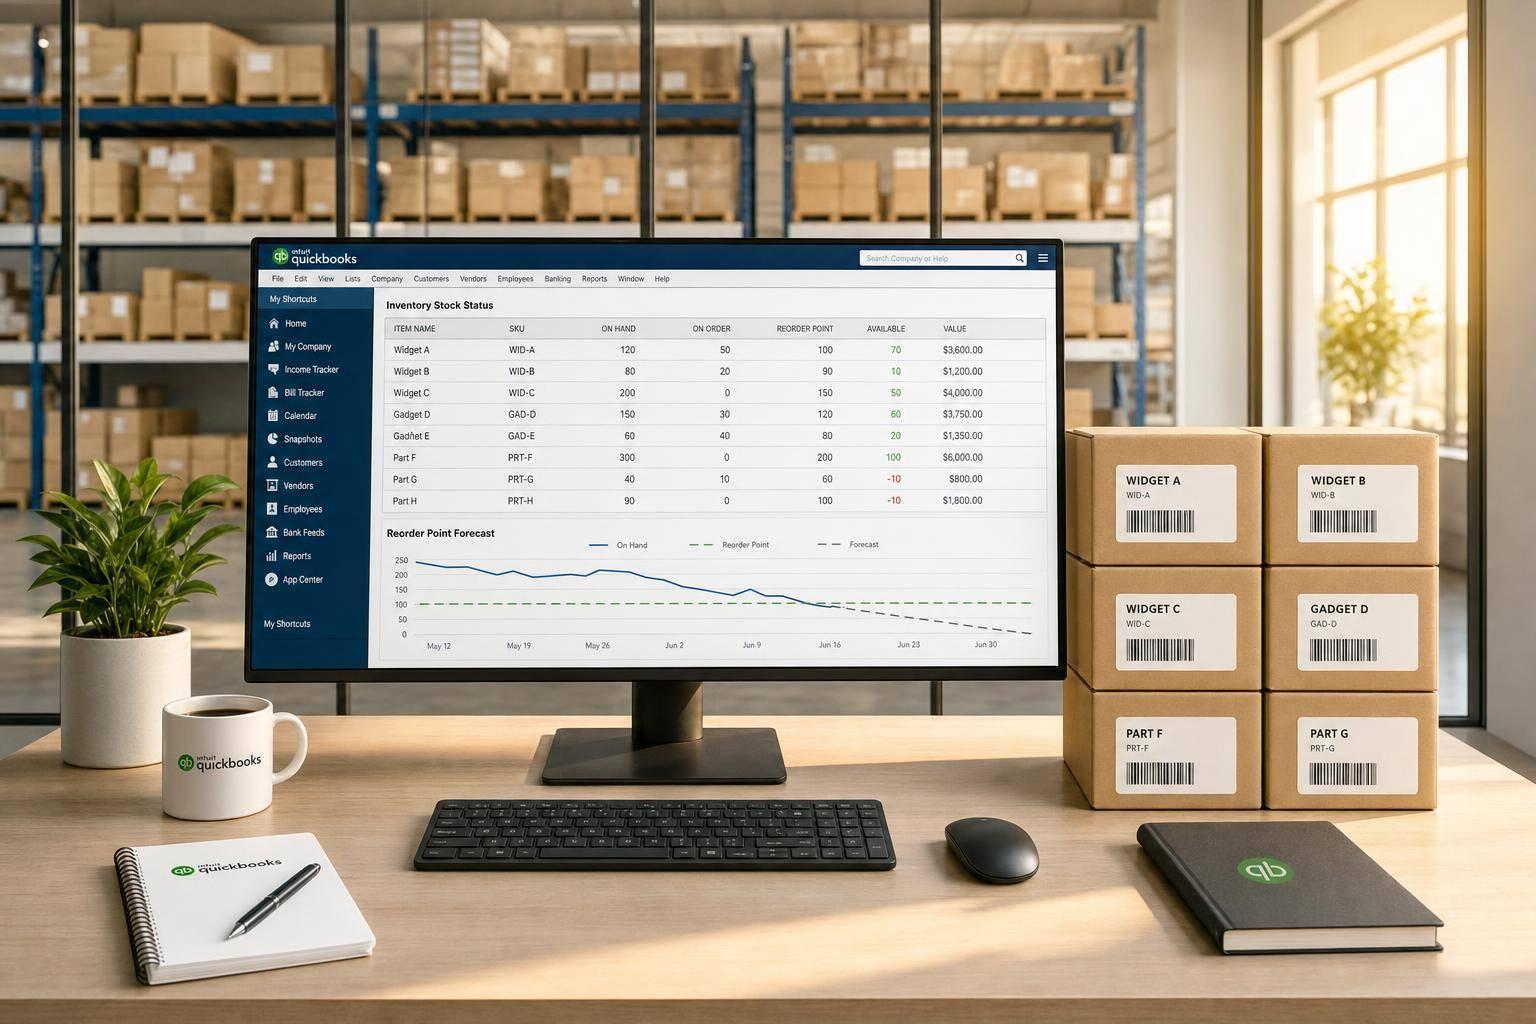
- Inventory Stock Status by Site (Enterprise only) - shows on-hand, committed, on-order, available, reorder point, and average sales by location
- Sales by Item Detail - helps you look at sales history and spot demand patterns
Use at least one full quarter of data so short-term swings don't throw off your numbers. If you're using Enterprise assemblies, turn on Full Assemblies so component demand is included.
Calculate Reorder Points And Safety Stock
Once you have Average Sales data, the math is pretty direct:
Reorder Point = (Average Daily Usage × Average Lead Time in Days) + Safety Stock
Here’s a simple example. If an item sells 15 units per day on average and your supplier lead time is 10 days, your base reorder point is 150 units. Add a safety stock buffer of 30 units, and the reorder point becomes 180 units.
One thing matters here: use available quantity, not just raw on-hand quantity. In plain English, that means on-hand minus committed stock. If you skip that step, you may count inventory that’s already spoken for. Recalculate after major shifts in demand or lead time.
Apply Moving Averages And Seasonal Adjustments
For items with steady demand, the Average Sales figures in the site report can work as a solid starting point. Seasonal SKUs need a little more care. Flag those items so you can separate recurring seasonal patterns from your normal sales pace. Then compare like periods and adjust the baseline when demand keeps rising or falling at the same time each year.
These numbers get tighter once you add warehouse-level and barcode data.
Use a moving average for steady items. For seasonal SKUs, adjust by hand based on past patterns.
3. Add Warehouse, Multi-Location, And Barcode Inputs
When inventory is split across warehouses, stockrooms, or fulfillment areas, forecasting can go off course fast if you don't have a clean view of each site.
Use Site-Level Inventory To Plan By Warehouse
In QuickBooks Desktop Enterprise, the Inventory Stock Status by Site report lets you track Reorder Points, On Hand, On Sales Order, and Next Delivery Date for each location. That split matters. A shortage at one warehouse doesn't always mean it's time to create a new purchase order. Sometimes the stock already exists at another site and just needs to be transferred.
Before you place a new PO, pull the site report first. Then check whether a transfer can cover the gap. It's a simple step, but it changes the decision.
Using available quantity - on-hand minus committed sales orders - gives you a clearer picture of reorder needs than on-hand alone. The report also shows the Next Delivery Date from open purchase orders, so you can tell if replenishment is already in motion.
Use the site report to answer one practical question: Do we need to buy more, or just move what we already have? That turns the report into a working decision tool, not just a static stock view.
Improve Accuracy With Barcode Scanning And Immediate Quantity Updates
Manual entry causes mistakes in receiving, picking, transfers, and cycle counts. And those mistakes don't stay small for long. One bad quantity at receiving can distort available stock, throw off reorder points, and lead to either stockouts or excess orders.
Barcode scanning helps stop that problem where it starts. When staff scan items against purchase orders during receiving, quantity on hand updates right away. During picking, immediate quantity deductions help prevent a common mess: stock that still looks available in QuickBooks even though it's already been picked.
Here's where manual tracking tends to fail - and what barcode-backed workflows fix.
Manual Tracking vs. Barcode-Supported Tracking
| Process | Manual Issues | Barcode-Supported Benefits | Forecast Impact |
|---|---|---|---|
| Receiving | Data entry errors; lag between physical arrival and system update | Instant QOH updates; automated SKU validation against open POs | Prevents stockouts from inaccurate counts; captures lead-time data accurately |
| Picking/Packing | Miscounts; items pulled from wrong bins or sites | Real-time stock deduction; validation alerts for wrong items | Maintains accurate available quantity for sales demand planning |
| Transfers | Stock "lost" in transit; paperwork not filed | Scanned "from" and "to" locations create a full audit trail | Prevents double-ordering by showing stock is in transit between sites |
| Cycle Counts | Time-consuming; requires operational slowdowns | Rapid, periodic counts via mobile devices; ABC analysis support | Frequent updates reduce MAPE in forecasts |
For cycle counts, mobile scanners such as the Zebra TC21 or TC26 are natively supported by the QuickBooks Desktop Warehouse app for real-time syncing. More frequent cycle counts help keep the data used for forecasting clean.
And cleaner inventory data flows straight into reorder calculations.
Use Rapid Inventory To Strengthen QuickBooks Desktop Forecast Inputs
Rapid Inventory adds two-way sync with QuickBooks Desktop, so transactions recorded in the warehouse flow into your company file without manual uploads. It supports multi-location tracking, mobile barcode scanning, lot and serial number tracking, FIFO/FEFO picking workflows, cycle counting, and backorder tracking. The result is more accurate on-hand balances and steadier reorder triggers across every site.
Once site-level and barcode data are flowing into QuickBooks Desktop, the next move is to compare forecasted demand with actual sales on a set schedule.
4. Review Forecast Accuracy And Adjust On A Set Schedule
Use a monthly review and a quarterly reset to keep your forecast current. The good news: you can do this with the same item, sales, and site data already in QuickBooks. The goal is simple - check whether your forecast still matches actual demand, then fix what’s off before it turns into overbuying or stockouts.
Compare Forecasts Against Actual Sales Each Month
Each month, pull the Sales by Item Detail report from QuickBooks Desktop and compare your forecasted demand with actual sales for your key SKUs. If you run more than one location, the Inventory Stock Status by Site report helps you see whether on-hand stock still lines up with the plan. Use this check-in to flag items that need a count or an adjustment.
Then, once per quarter, go deeper. Review seasonal patterns, supplier lead times, and whether your reorder points and safety stock still match current buying behavior. Recalculate reorder points about once every quarter, and change them right away if a supplier’s lead time shifts. If physical counts still don’t match your records, review the Inventory Adjustment History report to spot shrinkage, damage, or data-entry mistakes.
Track MAPE, WAPE, And Bias In A Spreadsheet
Export the Sales by Item Detail or Inventory Stock Status by Site report into a spreadsheet. From there, calculate a few basic forecast accuracy metrics before you change any reorder settings.
MAPE shows the average percentage error in your forecast. WAPE puts more weight on high-volume items. Bias shows whether you keep over-forecasting or under-forecasting demand.
Forecast Accuracy Metrics
| Metric | Formula | What It Tells You | Use In Planning |
|---|---|---|---|
| MAPE | SUM(ABS(Actual - Forecast) / Actual) / n | Average percentage error across all forecasted items. | Identifies which SKUs have the largest forecast gaps. |
| WAPE | SUM(ABS(Actual - Forecast)) / SUM(Actual) | Error weighted by sales volume. | Focuses attention on high-volume items that drive most revenue. |
| Bias | SUM(Forecast - Actual) | Whether you are consistently over- or under-estimating demand. | Positive bias means overbuying; negative bias means stockout risk. |
A simple spreadsheet can tell you a lot. If MAPE is high, your item-level forecast may be too far off to trust. If WAPE is high, your biggest sellers are missing the mark, which can hit sales harder. And if bias keeps leaning positive or negative, that’s a sign your planning process needs correction - not just a one-off tweak.
Update Reorder Points, Safety Stock, And Counting Routines
After you measure error, update the settings that drive replenishment. Recalculate reorder points every 90 days, and update them right away when lead times change. Use the formula Average Daily Usage × Lead Time + Safety Stock and enter the new values in your QuickBooks item records.
For items with uneven demand or supplier lead times that keep moving around, add more safety stock instead of waiting for a stockout to prove there’s a problem. That small buffer can save a lot of hassle.
Use cycle counts between full counts to keep QuickBooks lined up with physical stock. Focus first on high-value or fast-moving items with ABC analysis, and fix any issues before the next forecast cycle.
Conclusion: Build A Repeatable Forecasting Process In QuickBooks Desktop
Reliable QuickBooks Desktop forecasting comes down to four habits: clean data, the right reports, practical formulas, and a set review schedule.
That only works if the records underneath it stay clean. Make sure item, location, supplier, and cost data are accurate before you lean on any report. And for site-level planning, use available quantity instead of only on-hand quantity.
Barcode scanning and site-level tracking make your forecast inputs sharper. For multi-location operations, Rapid Inventory adds two-way sync, barcode scanning, and multi-location tracking to help keep forecast inputs accurate.
Then keep the process going with monthly checks and quarterly resets. Compare forecasts with actual sales, track MAPE, WAPE, and bias in a spreadsheet, and use cycle counts to keep QuickBooks records lined up with physical stock. That rhythm keeps forecast inputs current.
FAQs
How much sales history should I use?
Use enough historical sales data to map demand trends, lead times, and seasonal patterns. In most cases, that means at least one full year of data so the forecast can reflect recurring spikes and dips.
When you pair that sales history with real-time inventory levels, it becomes much easier to set reorder points and safety stock levels with more precision. That helps cut the risk of overstock and stockouts.
What safety stock level should I set?
Set safety stock by weighing average daily usage, lead time, and current demand trends with historical sales data. The goal is simple: keep enough on hand to cushion normal supply chain swings without locking up too much cash in extra inventory.
Recalculate safety stock every quarter. And if an item keeps showing up on backorder reports for several months, bump its safety stock up to help avoid more stockouts.
When should I transfer stock instead of reordering?
Transfer stock instead of reordering when you run more than one location or warehouse and one site has too much while another is running low.
That way, you can rebalance inventory to match demand without spending money on products already sitting on your shelves. Real-time reporting helps you spot those gaps across locations, so you can move stock to the places that need it most.